Intel
WELCOME TO INTEL!
Duration | June 2021 - December 2021
Role | Business Intelligence Engineer
Teams | WIF-To-Deal, FCE Data Analytics, FCE Estimating
0.0 | TEAM & TOOLS
TEAM
Timothy Joo
Mahmoud Aghel
Ashean Patel
Eduardo Gamez
Erik Berg
Herb Shaffer
TOOLS
Microsoft Azure
Data Factory
Delta Lake
Synapse
Microsoft SQL Server Management Studio
PowerBI
1.0 | WHO / WHAT IS INTEL?
Intel is the world’s largest and leading semiconductor company in the entire world!!
…but what does that actually mean?
Think about it like this!
If you have ever owned any type of PC, Computer, or Laptop in the last 20 years, Intel has most likely been at the heart of that product or device.
It’s the company that makes the CPU processors in Desktop PCs, Laptops, and even in Data Centers. You would typically see this in an i5, i7, and or even an i9 variant.
What’s incredible about Intel is the company-wide passion to innovate and create beyond the current cutting-edge technology. With a new geared focus towards AI, Software, GPUs, and semiconductor manufacturing as well as holding its ground in CPU technology, Intel is only just getting started.
2.0 | THE PROBLEM…? QUICKBASE…

XML DATA…
the backend data structure & table relationships connectors ONLY had this data type…
2.1 | The extreme challenges that came with using Quickbase
Backend XML Data format
Difficult to utilize outside of Quickbase only tools
Lack of unique visualizations
EX: Change over Time
EX: Aggregate Visualizations
Need for data validation across the entire platform
3.0 | STEPS TOWARDS THE SOLUTION
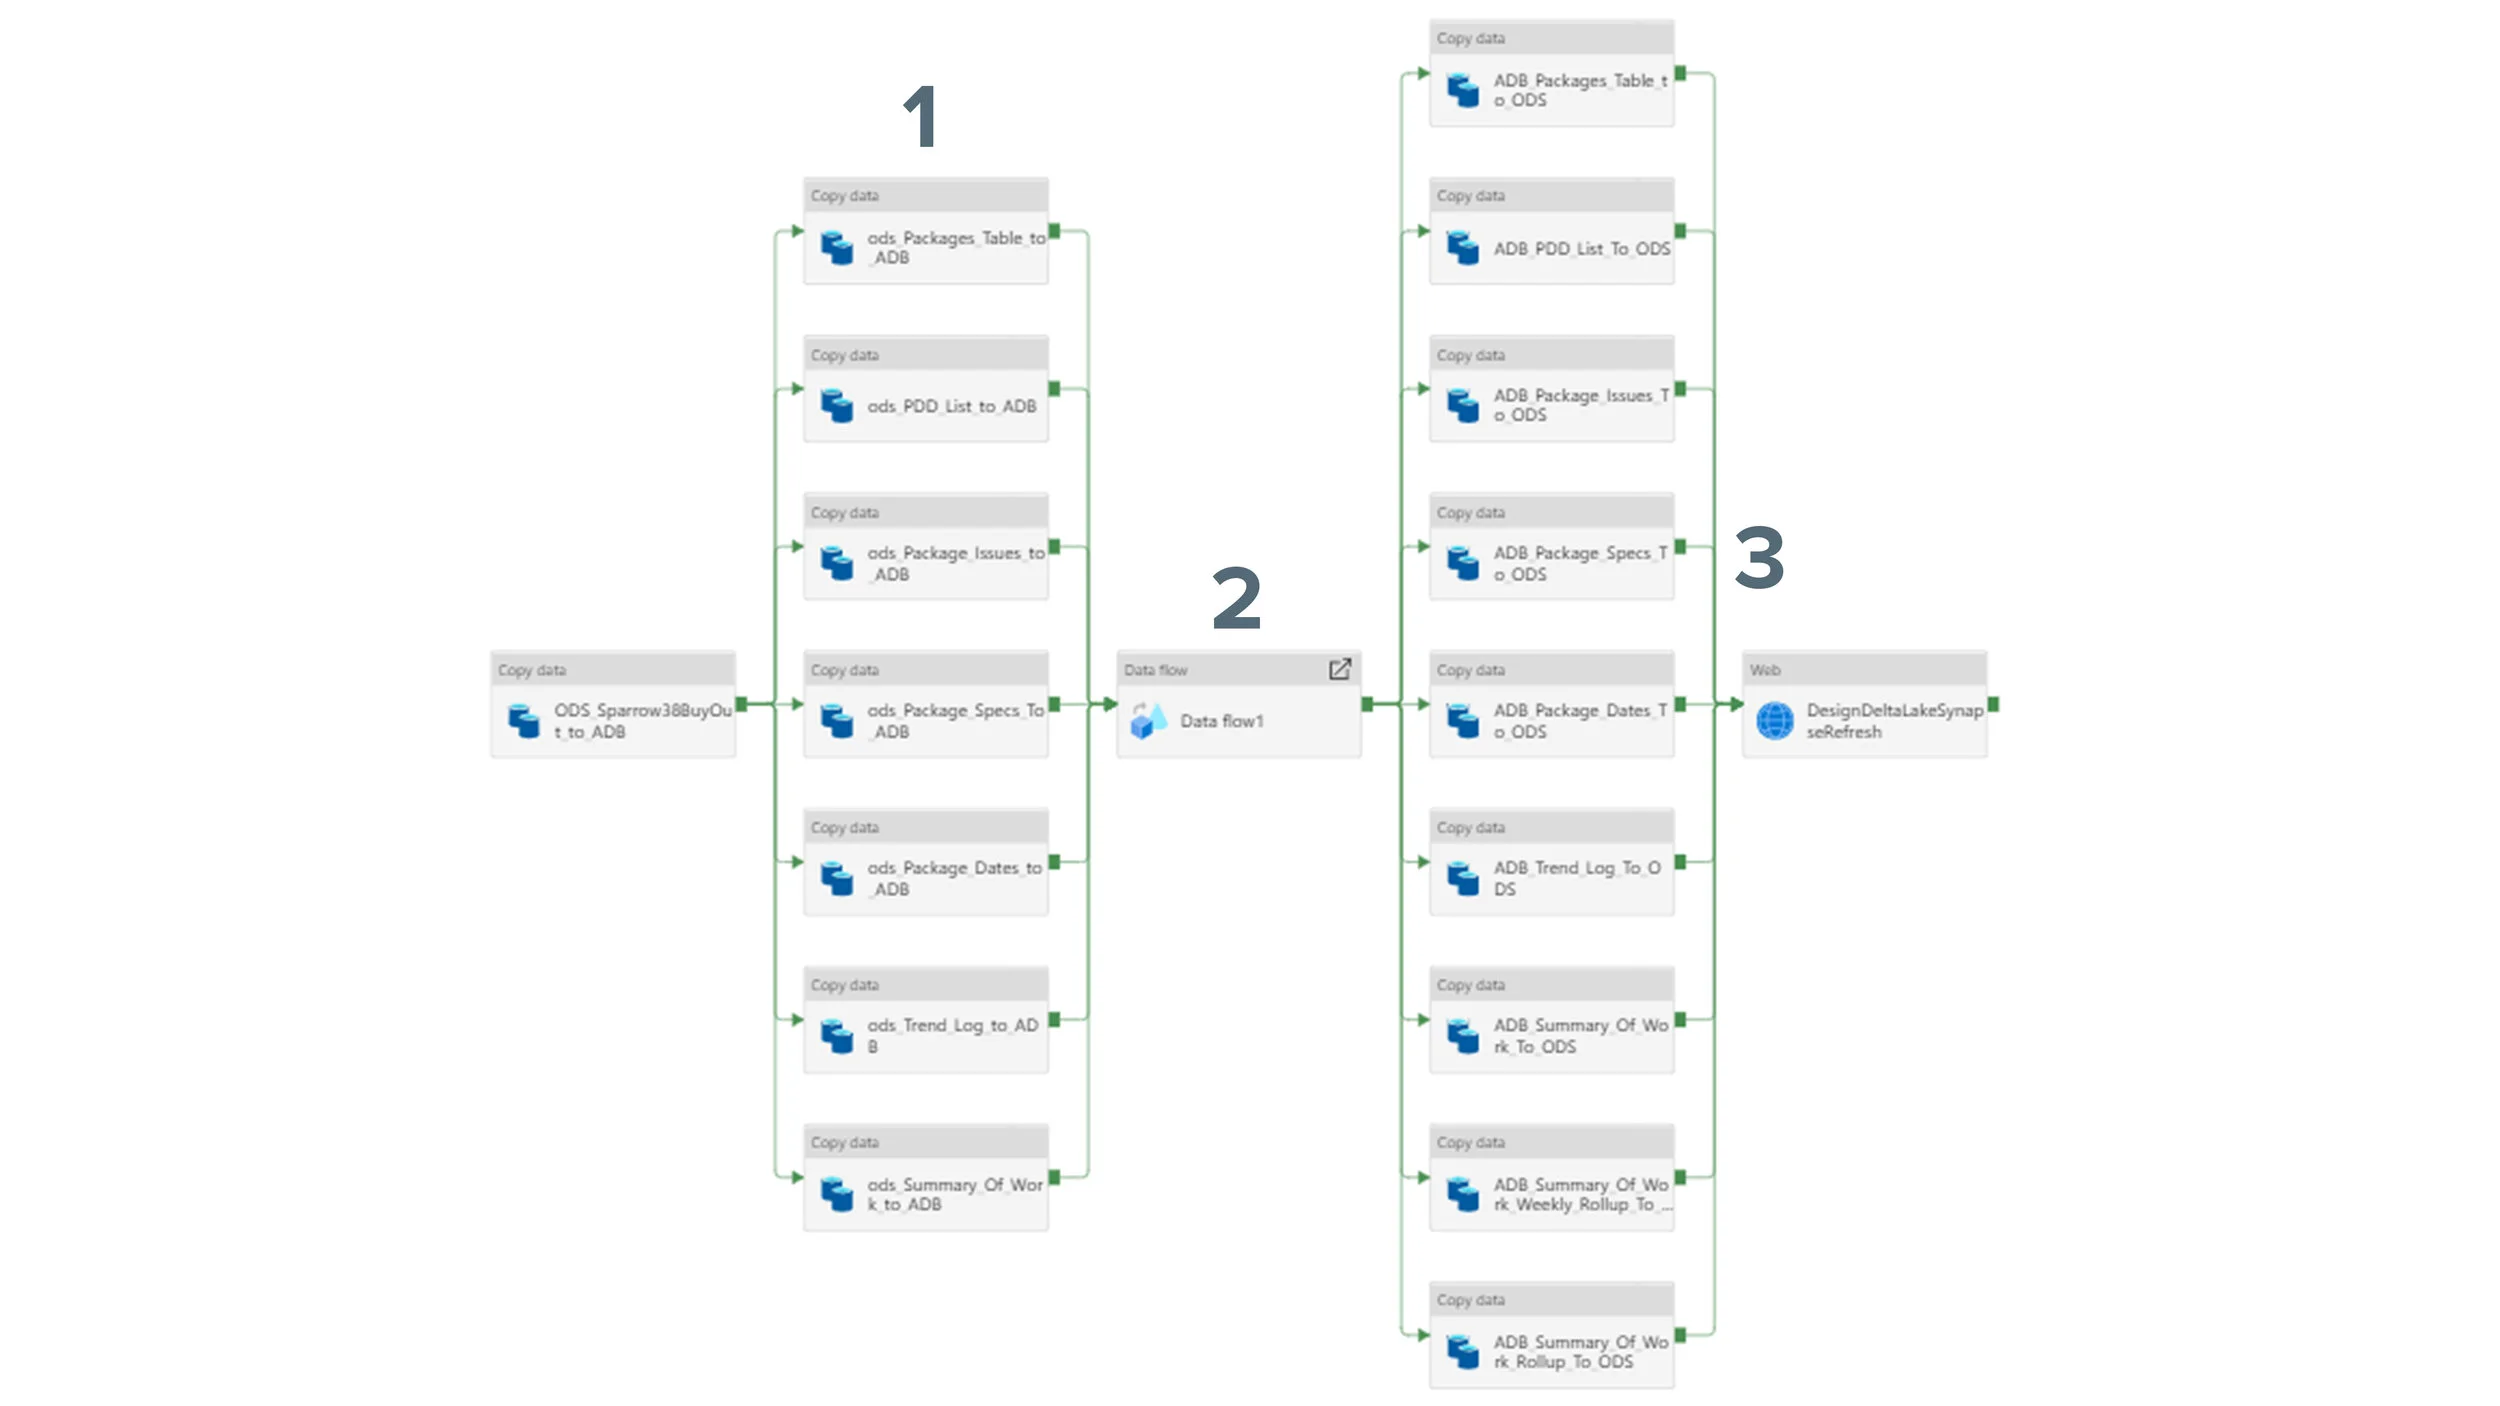
3.1 | THE BIG PICTURE
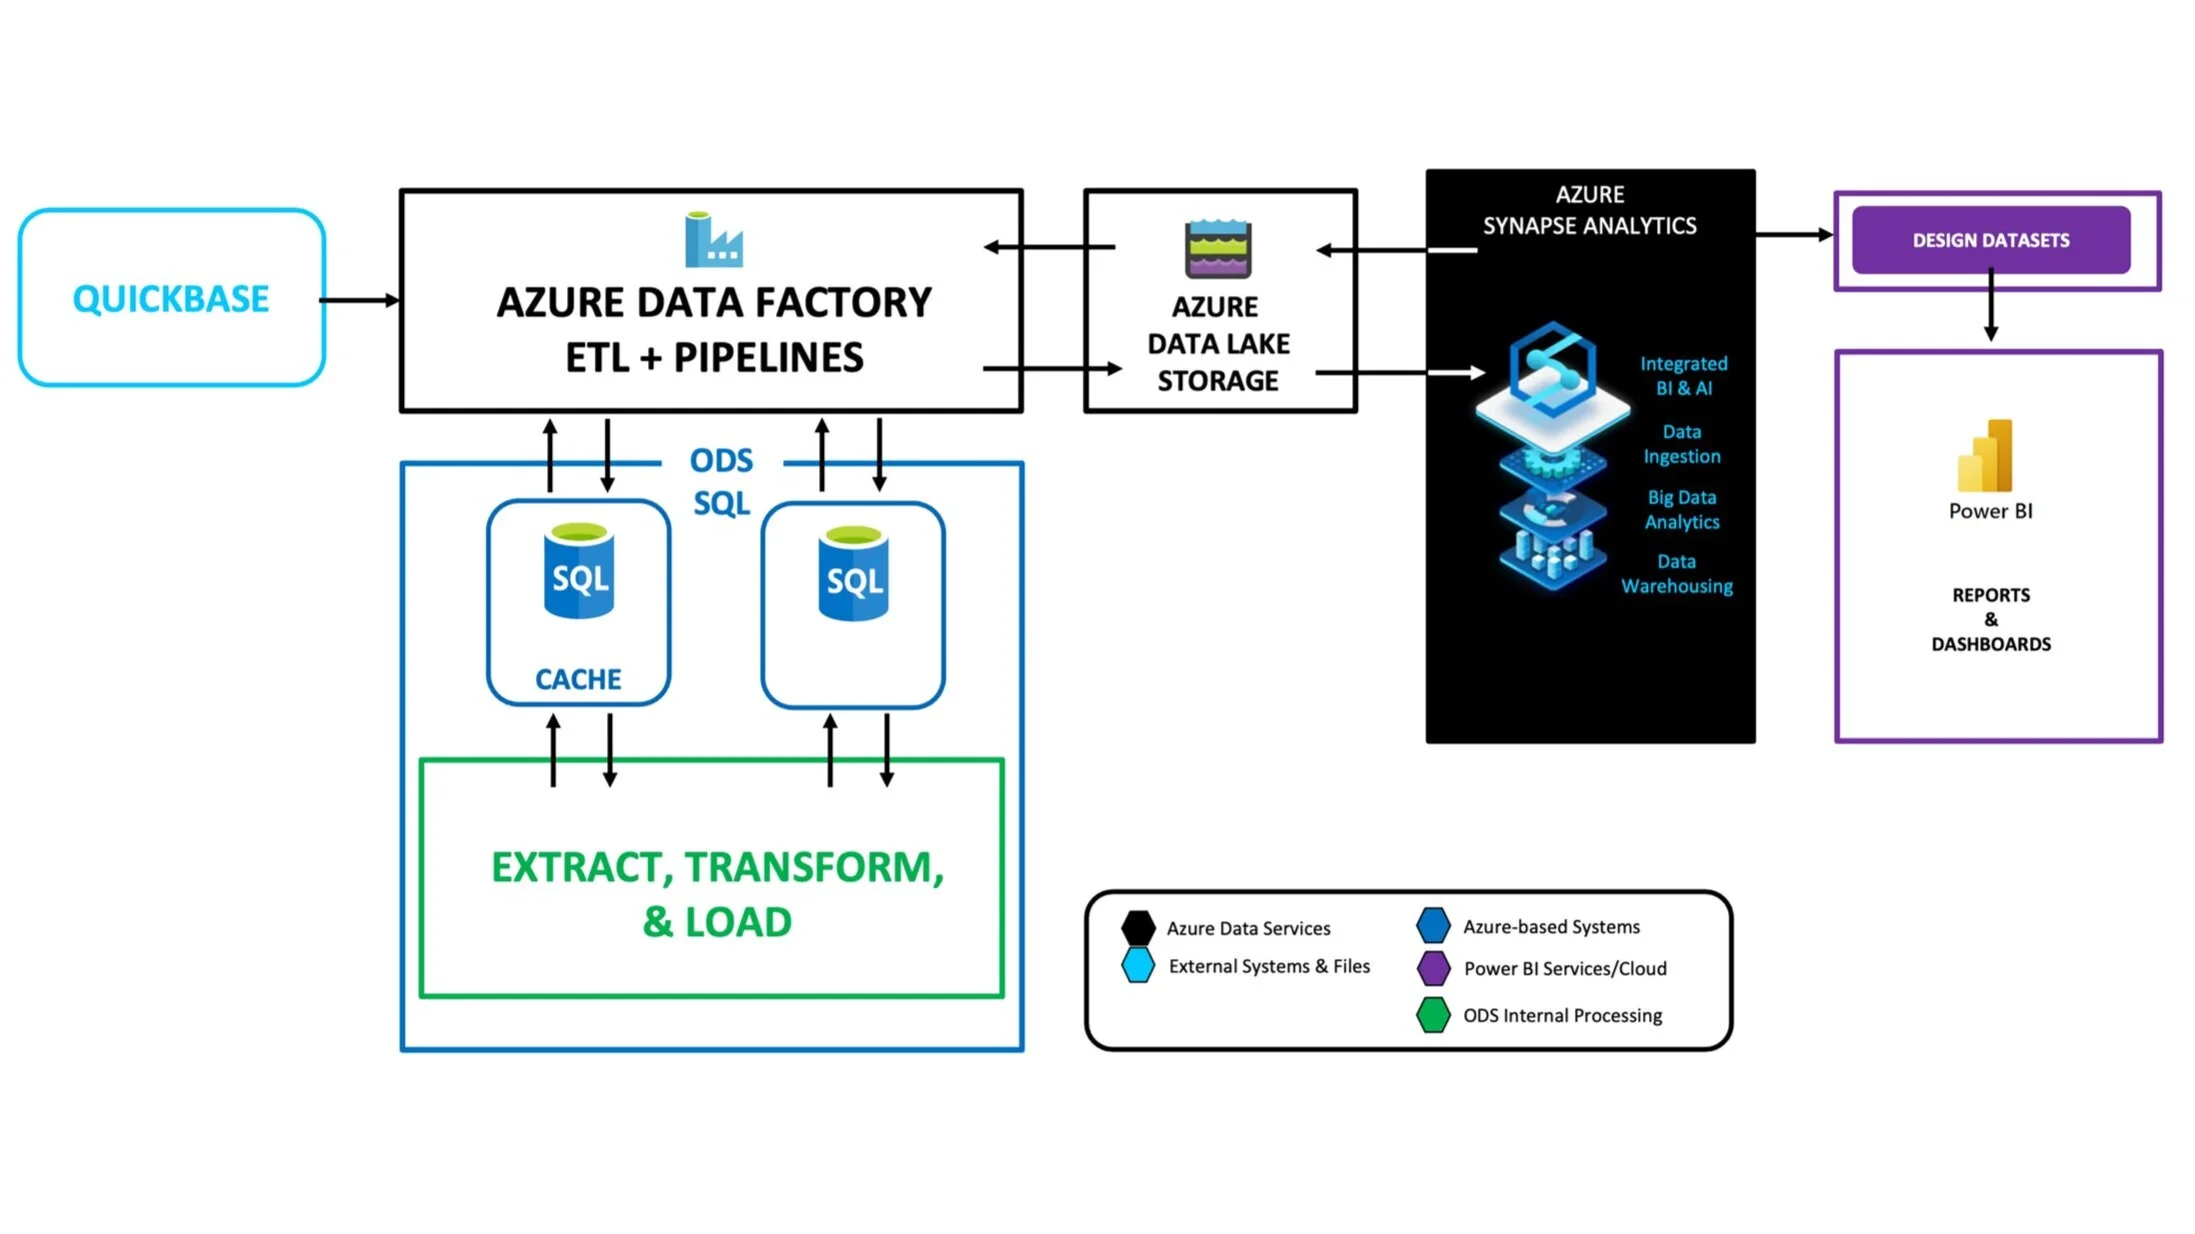
3.2 | ExtractING from quickbase INTO intel ODS
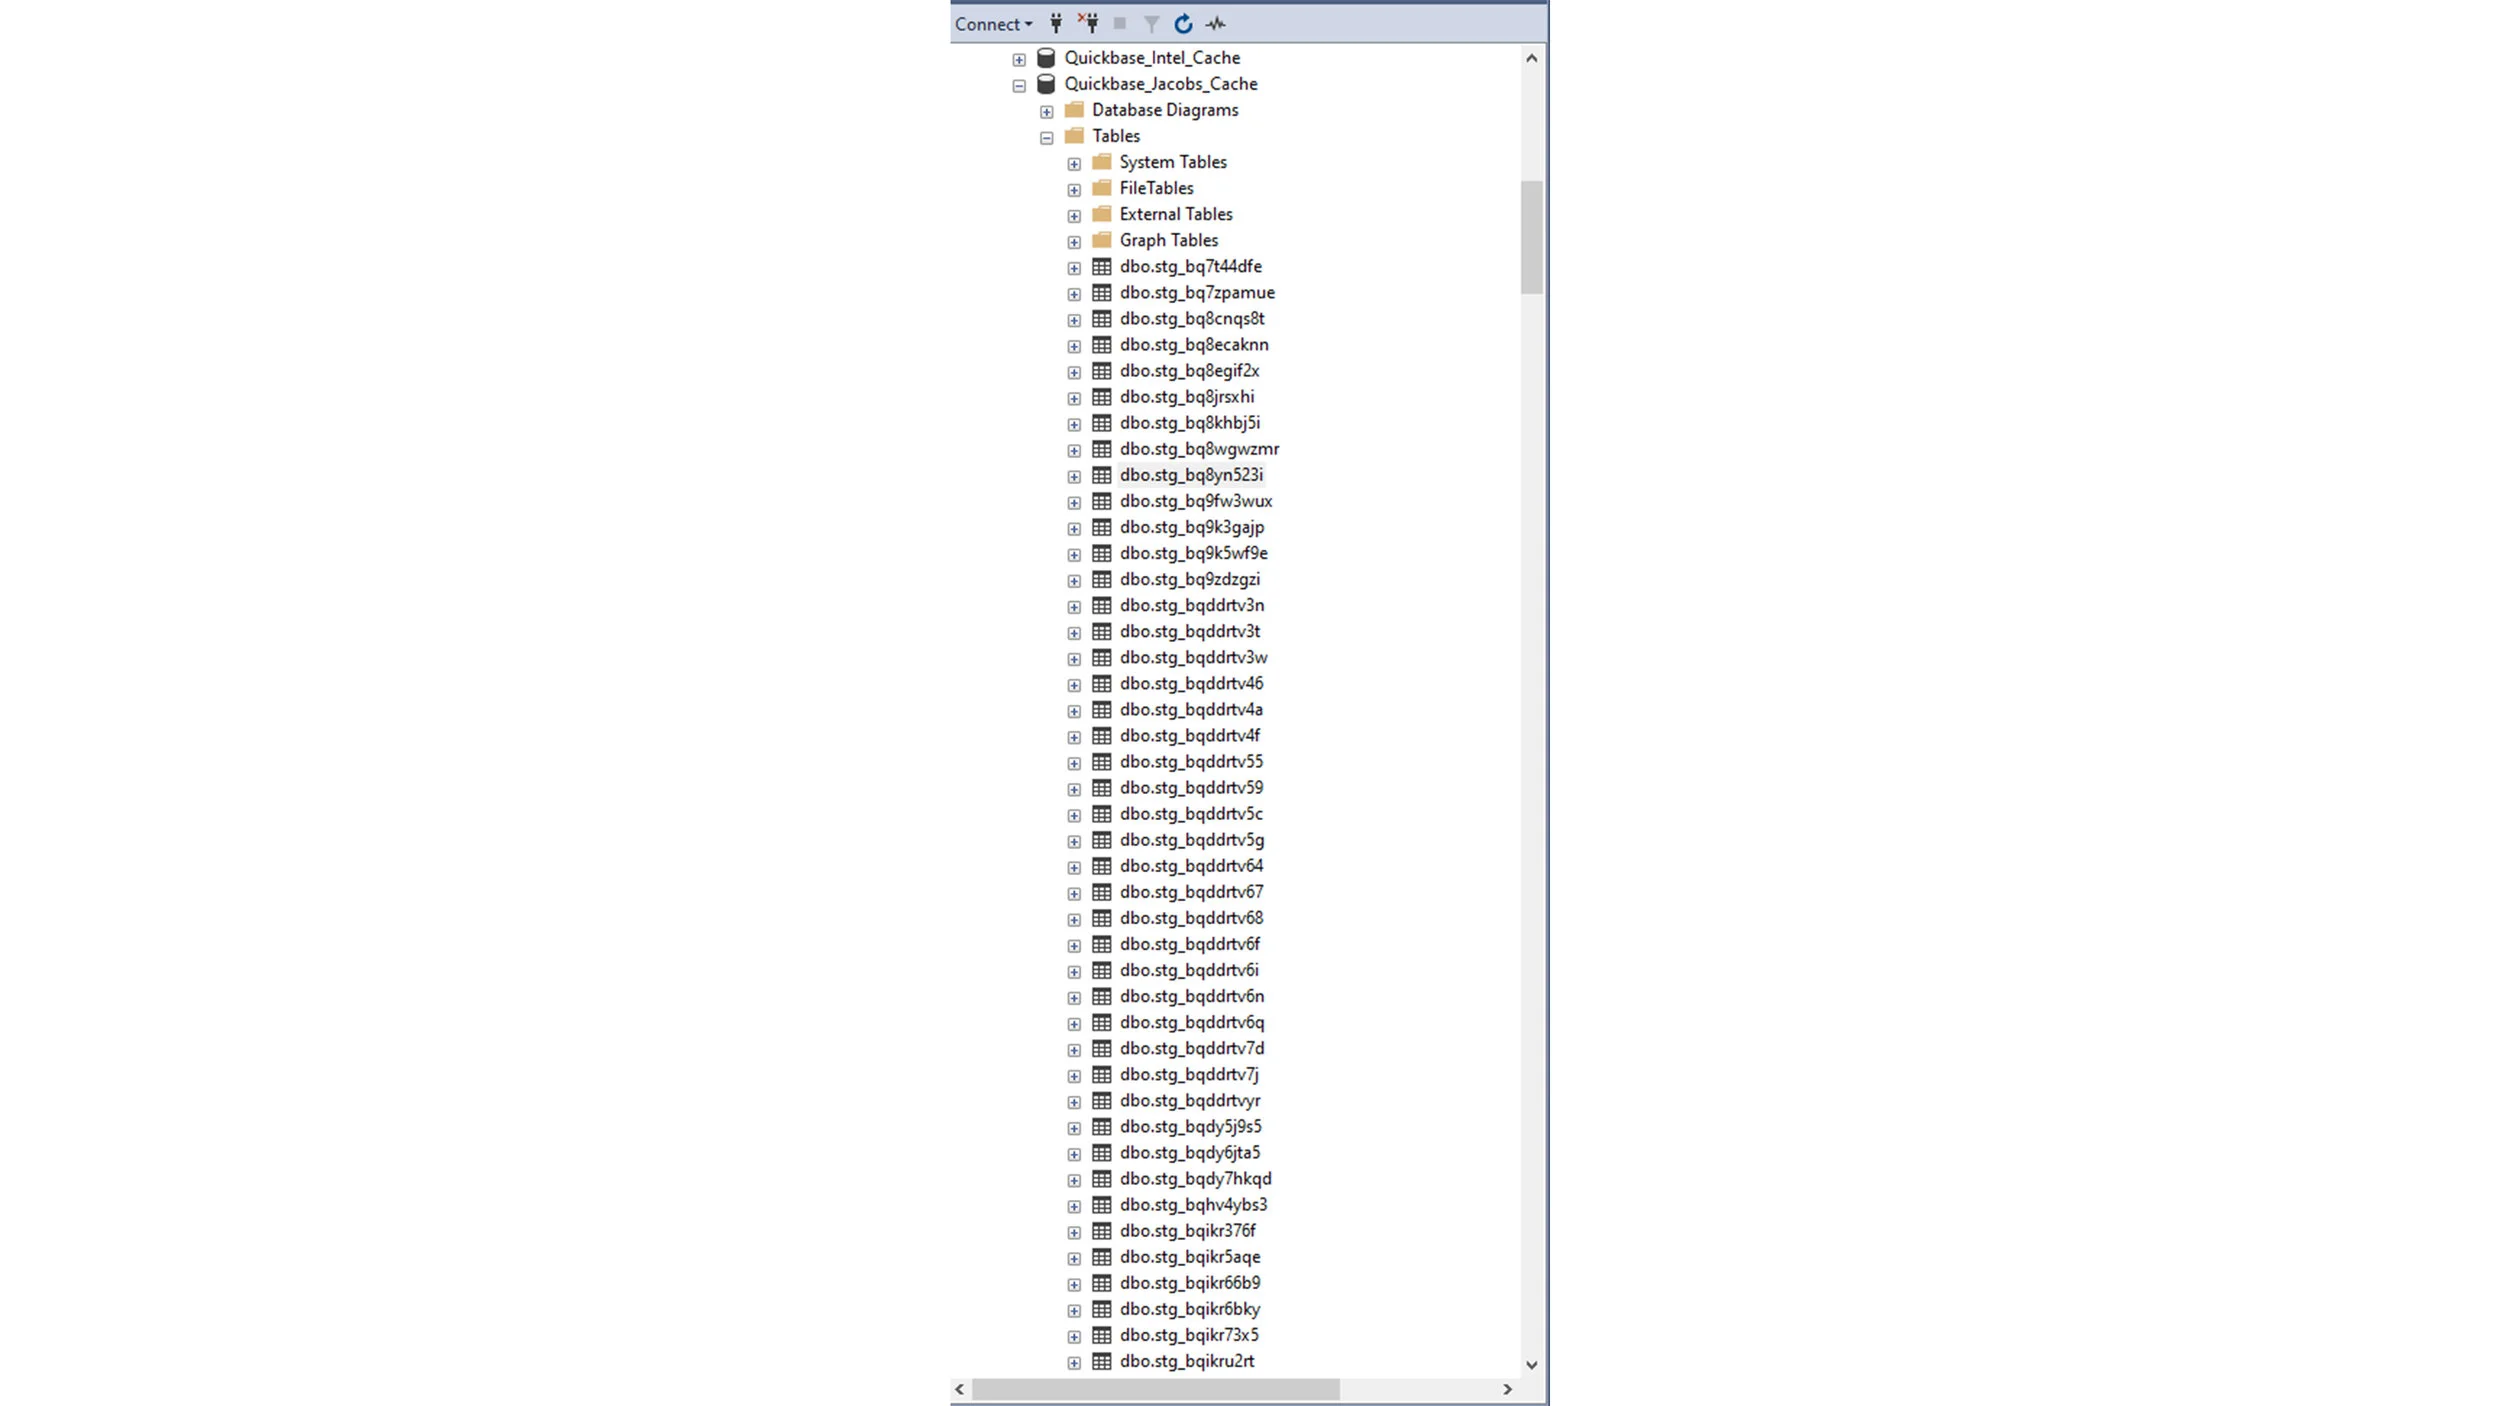
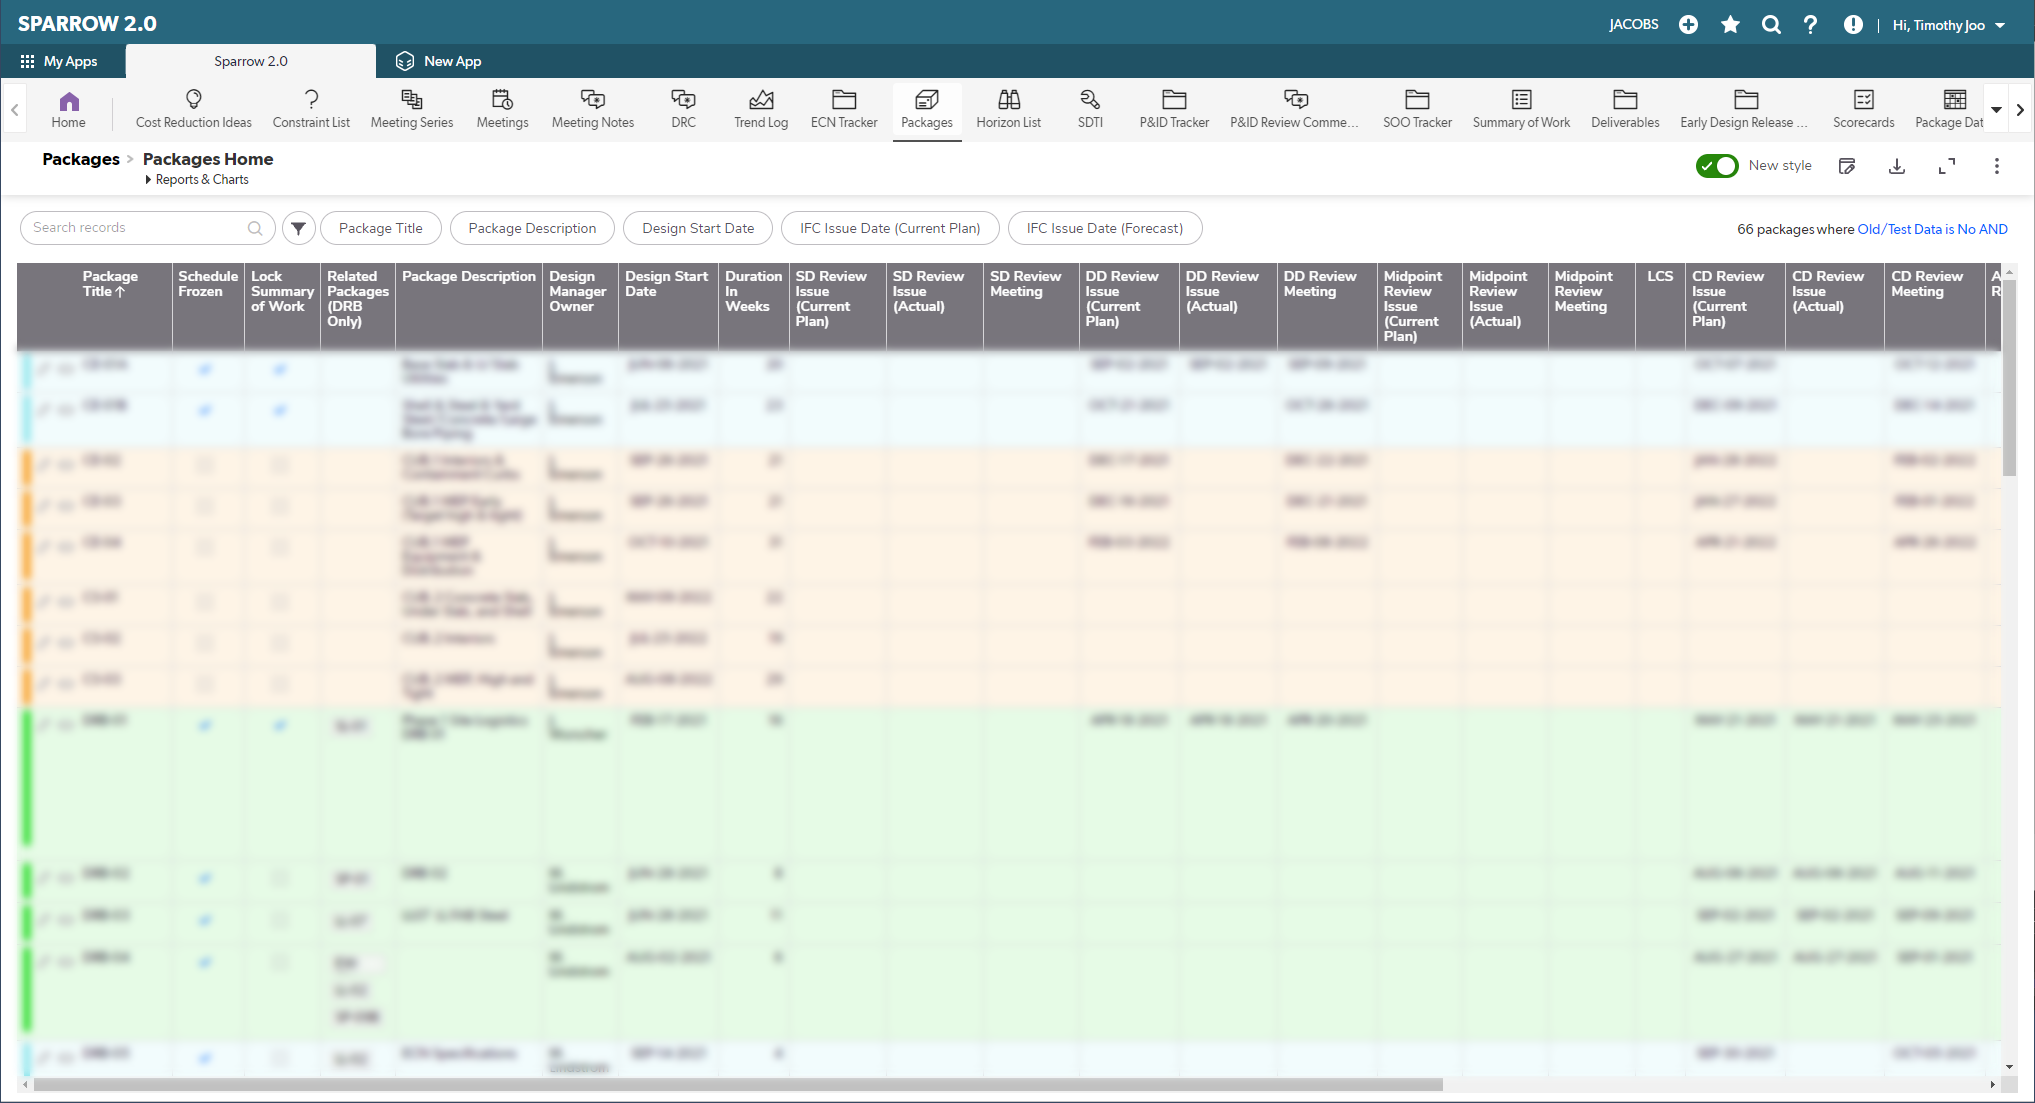
Through an API call, Quickbase data is brought into a Microsoft SQL Server Database Cache in Intel’s ODS Servers. This includes the time every row was brought in as well as a TableID.
Alone, it is incredibly difficult to read and understand. The table names by themselves (next image), clearly showcase the difficulties behind connecting all the tables via their true corresponding table relationships.
3.3 | TransformING in azure data factory
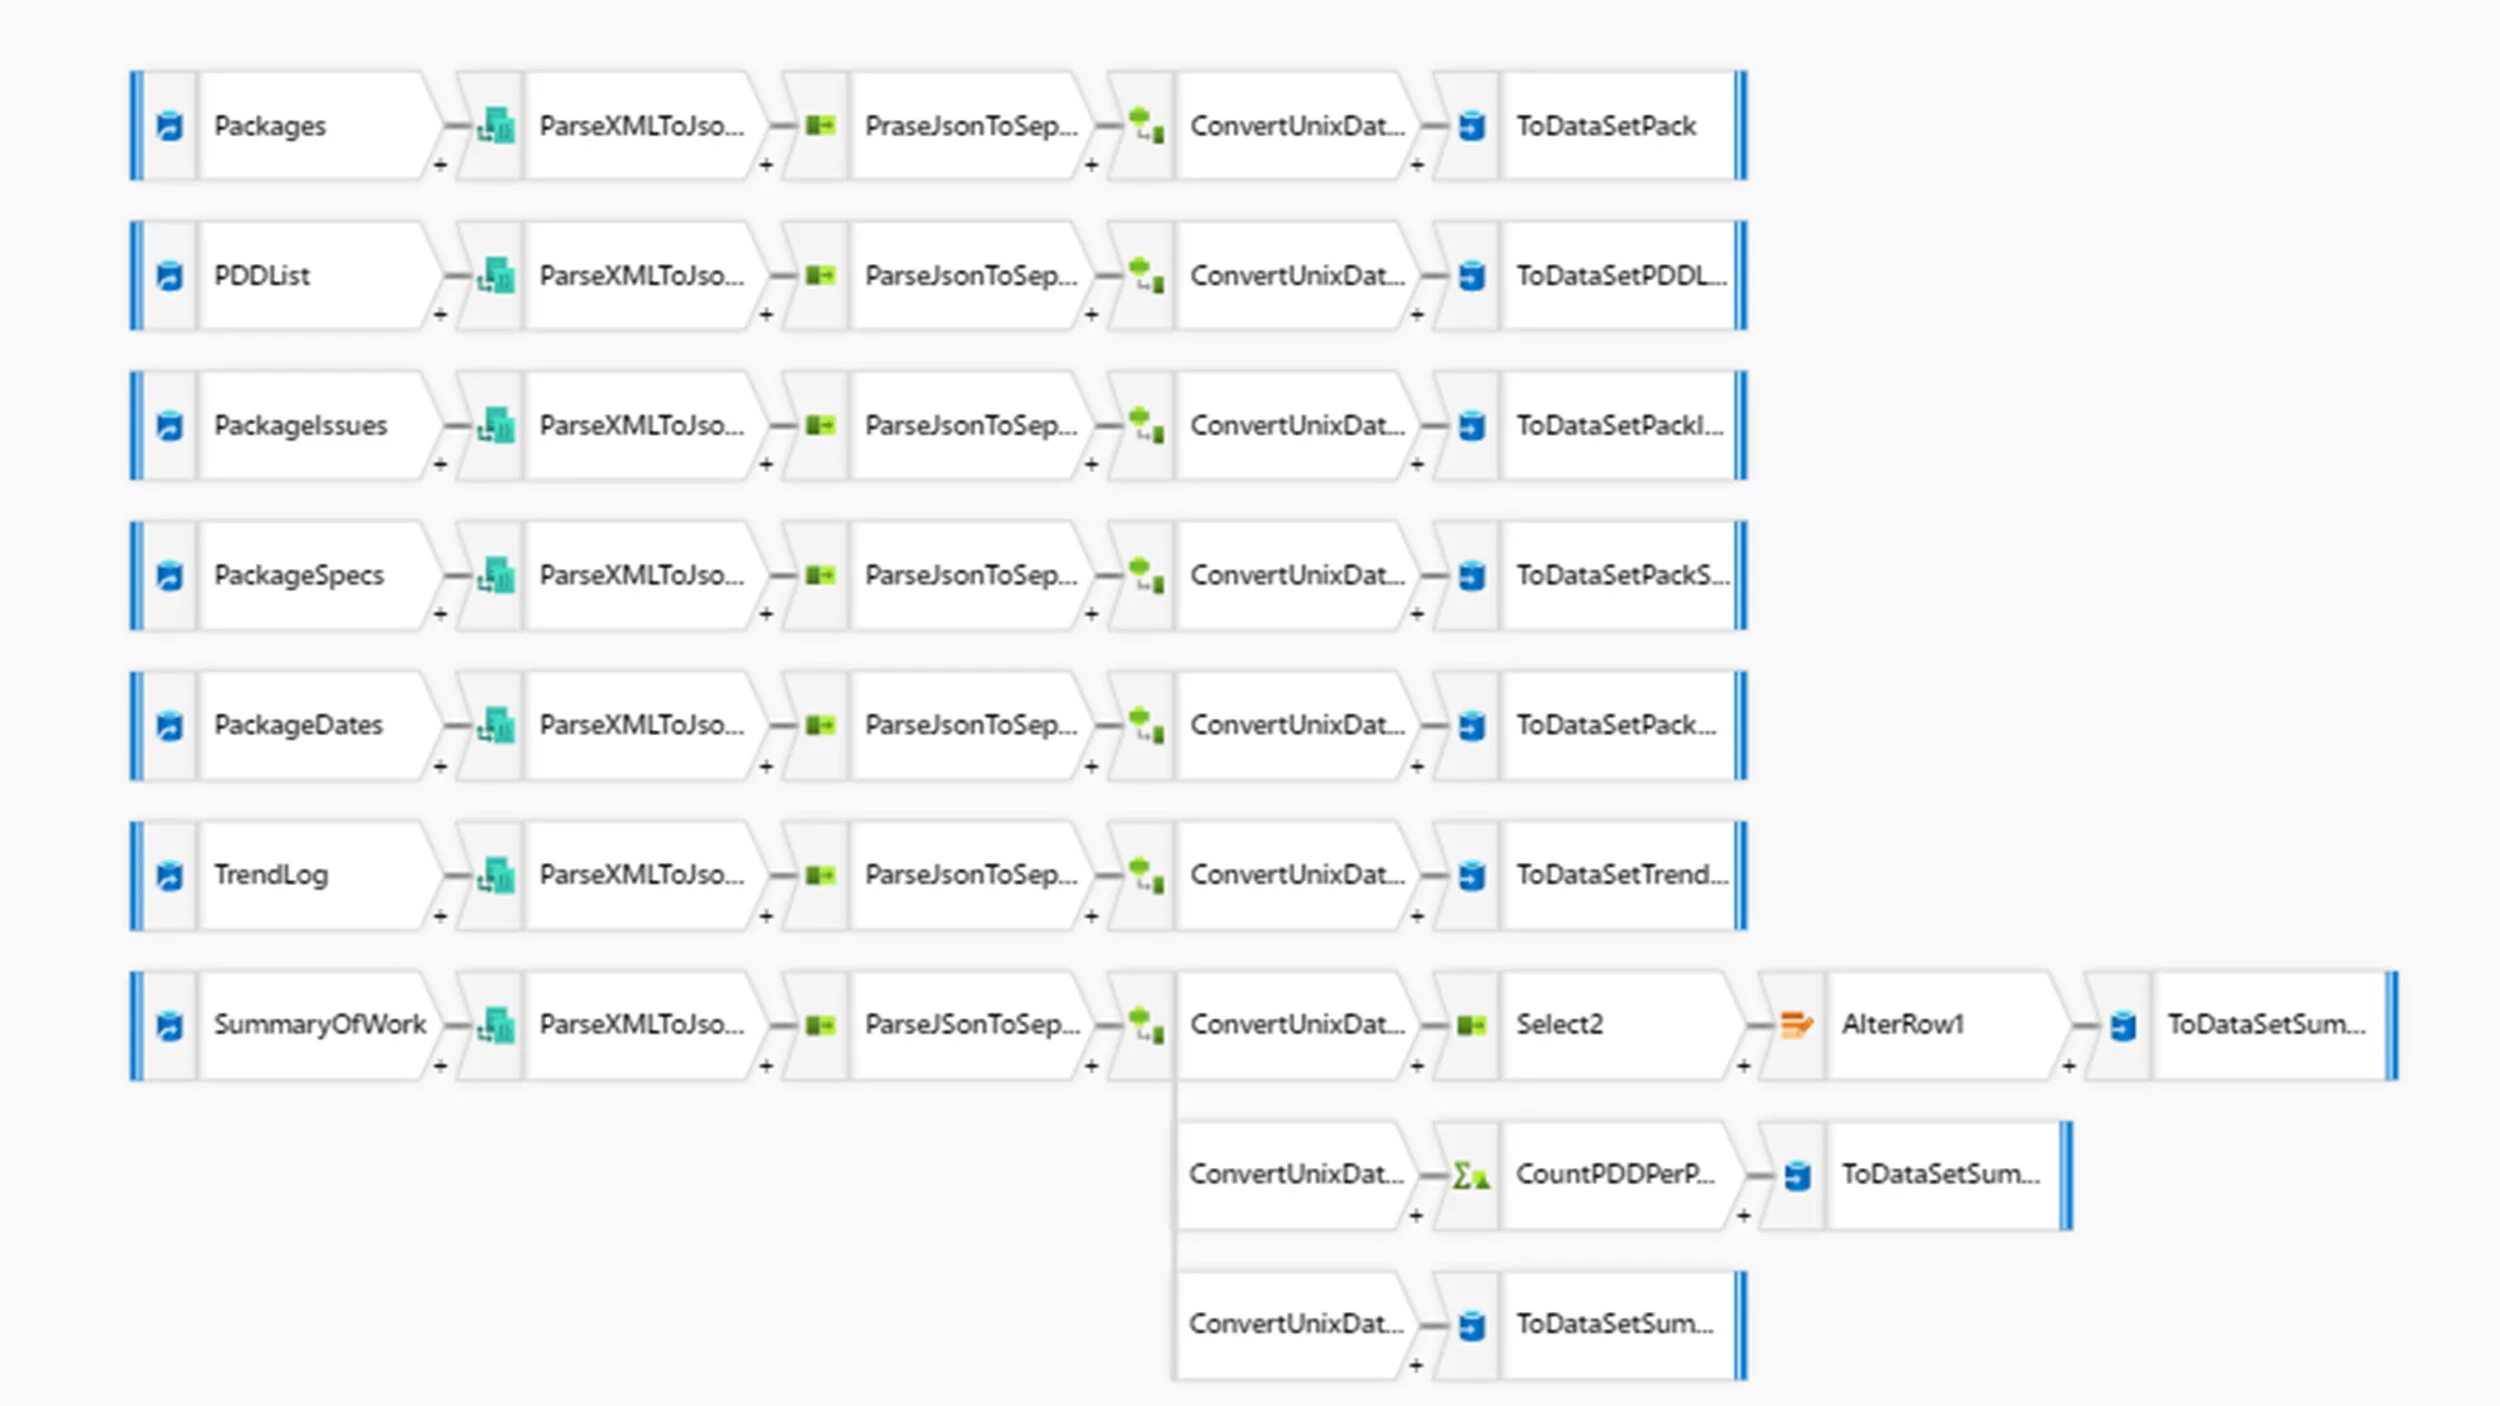
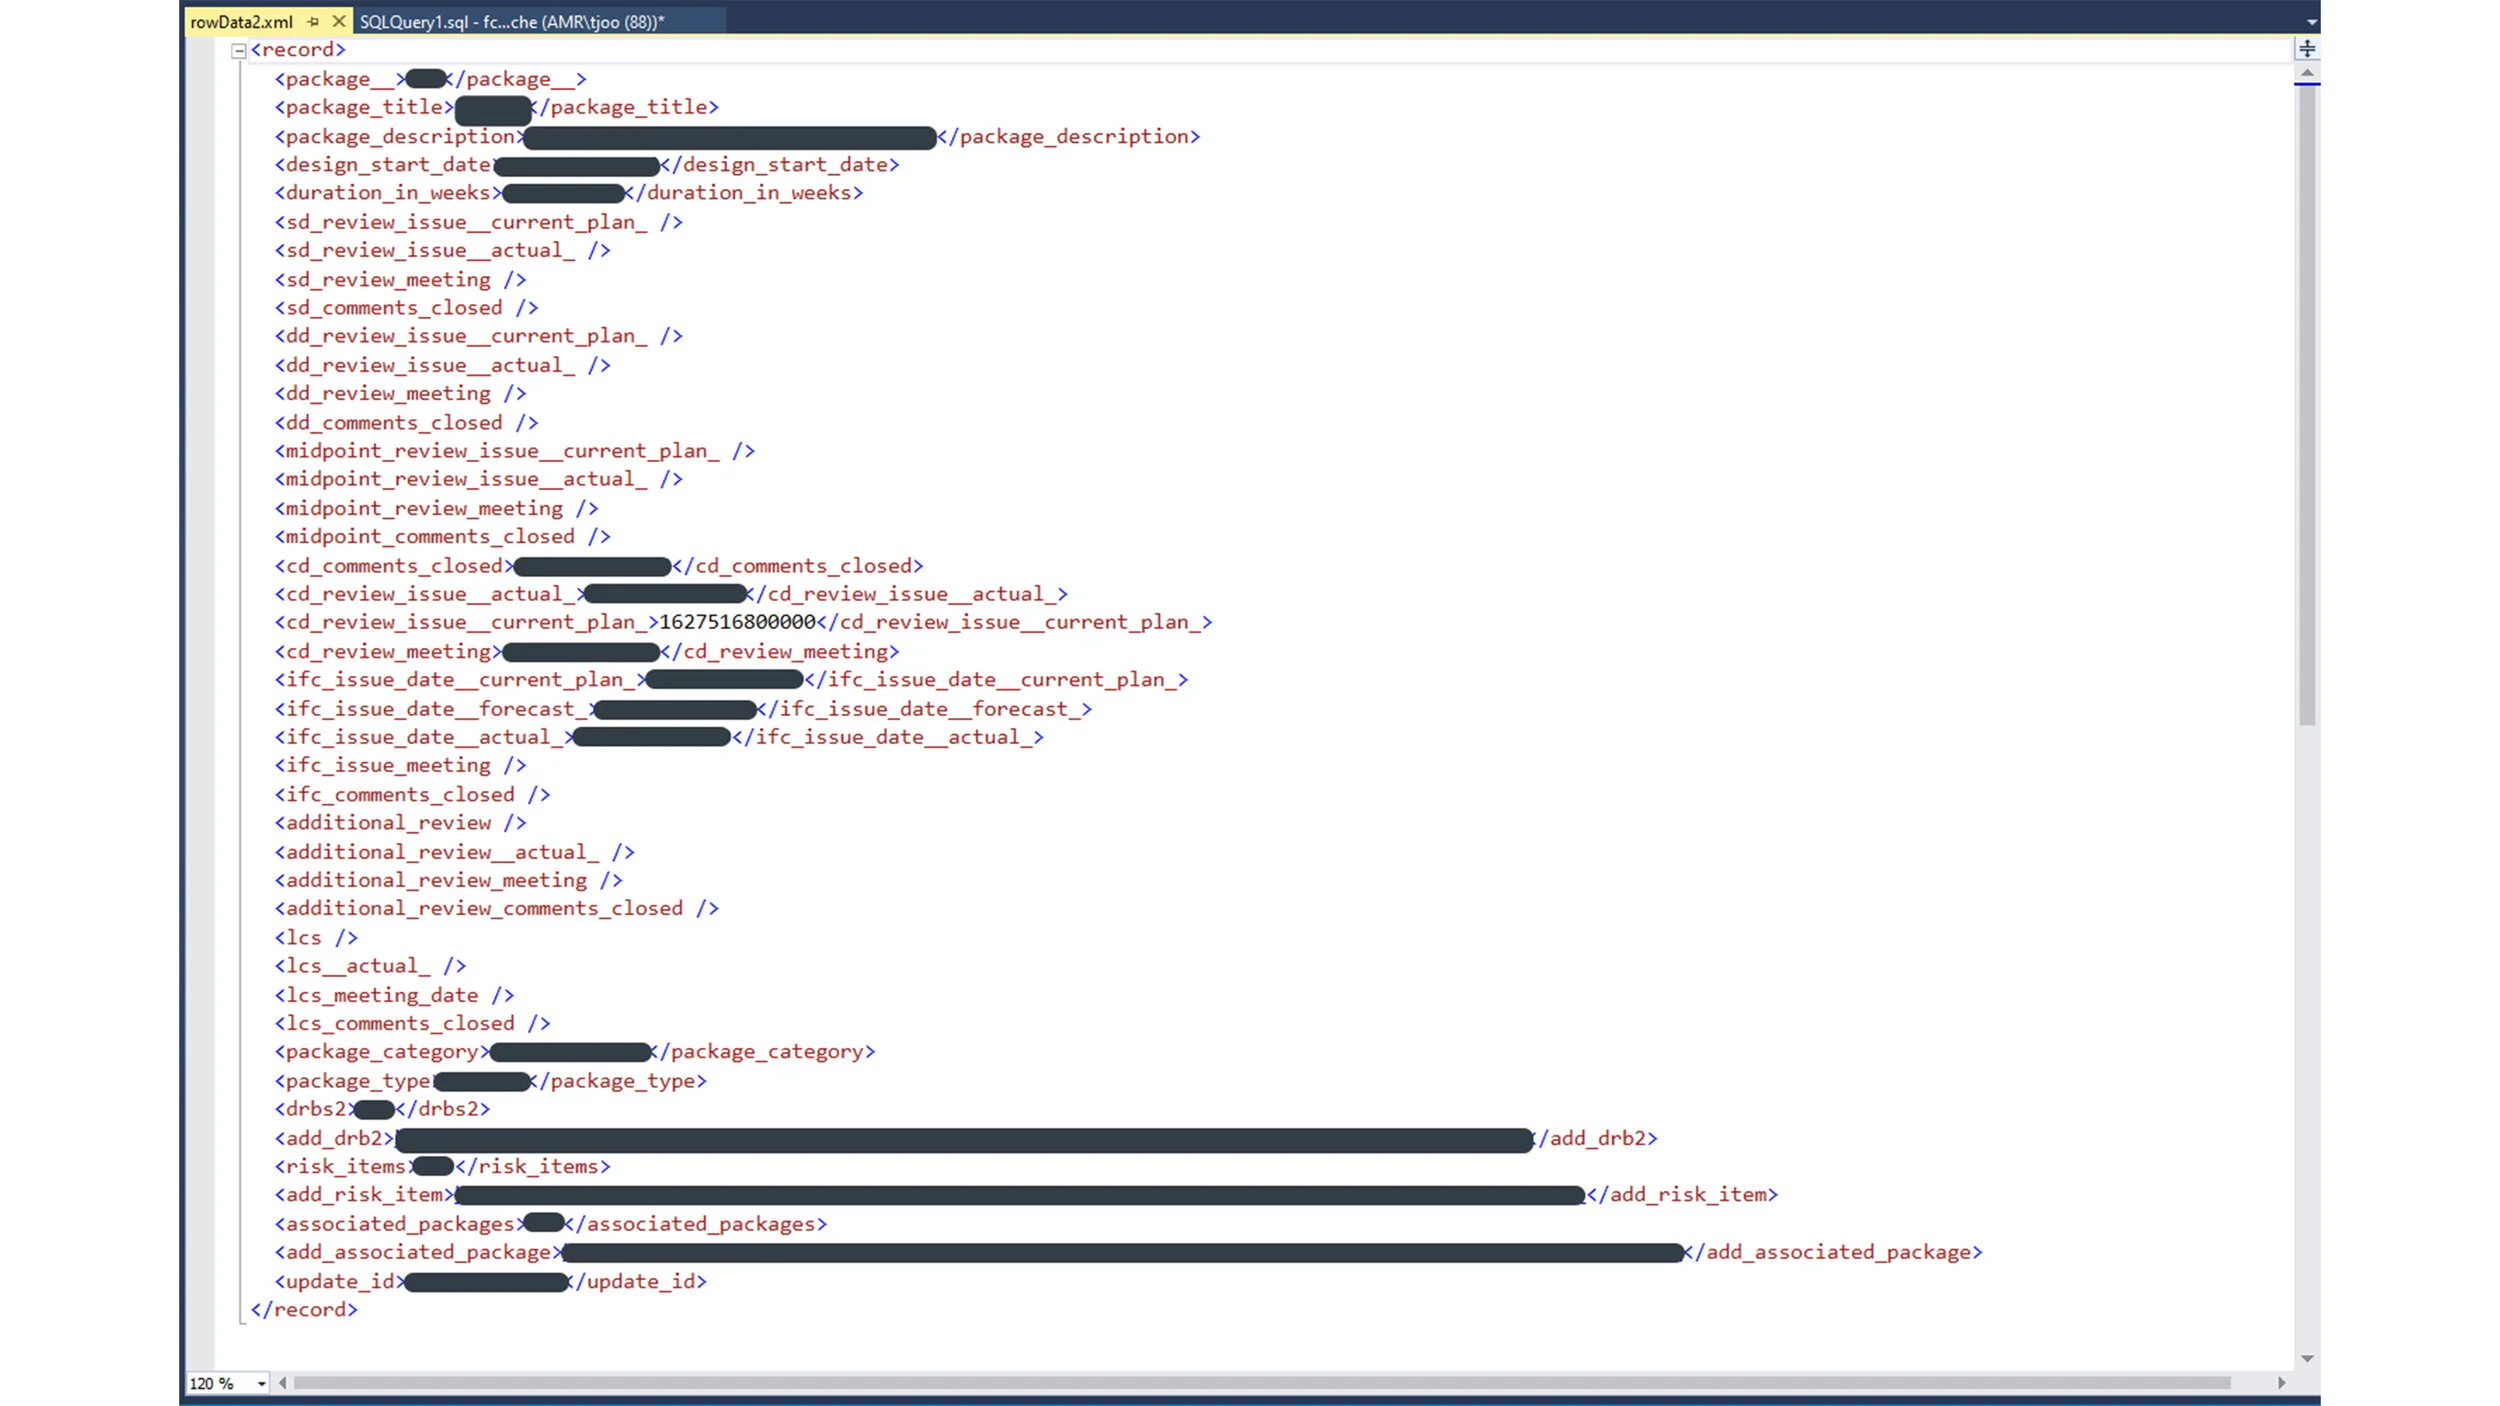
XML Data is brought into Azure Data Factory in its most RAW form.
It’s then transformed via a Dataflow that is then able to parse the XML row by row & column by column (next image).
Afterward, it’s brought back into ODS as a staging table that can be accessed by Delta Lake.
3.4 | Loading into synapse
DELTA LAKE TO SYNAPSE!
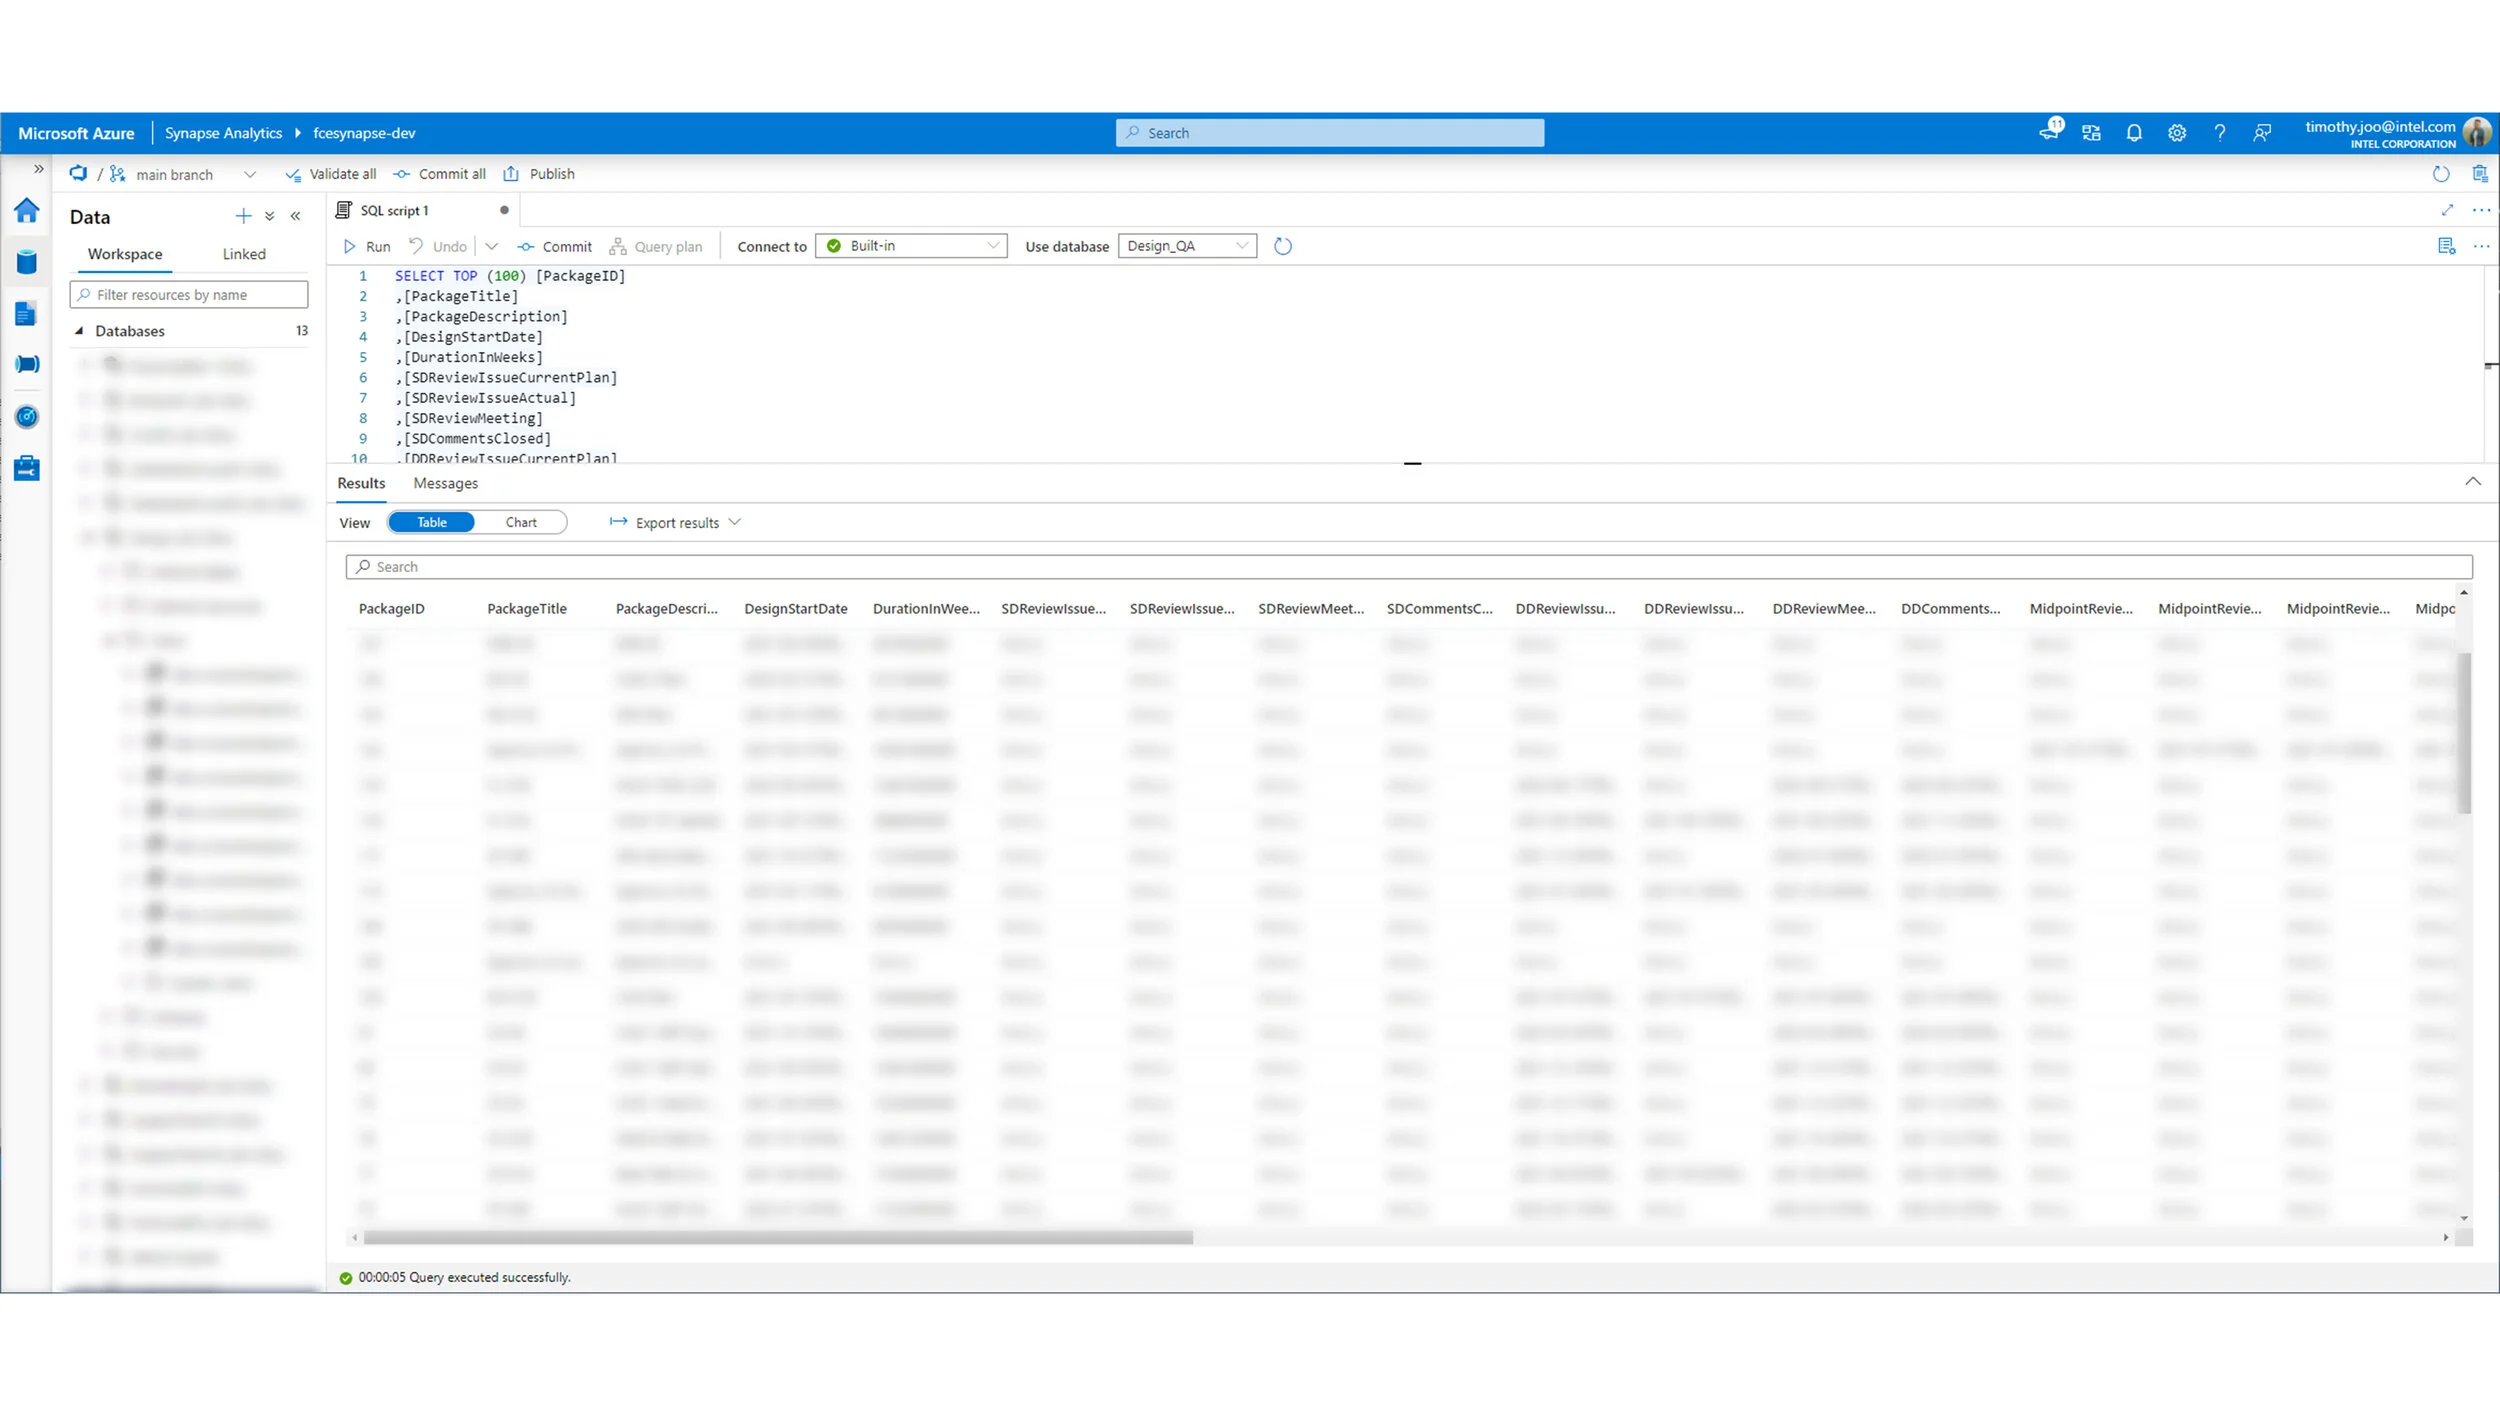
Synapse is where the data can be most efficiently accessed in its final form by Business Analysts and Managers alike through their Intel Credentials. This removes the need for a gateway connection between PowerBI Cloud and a specific user / their computer to gain access to a dataset.
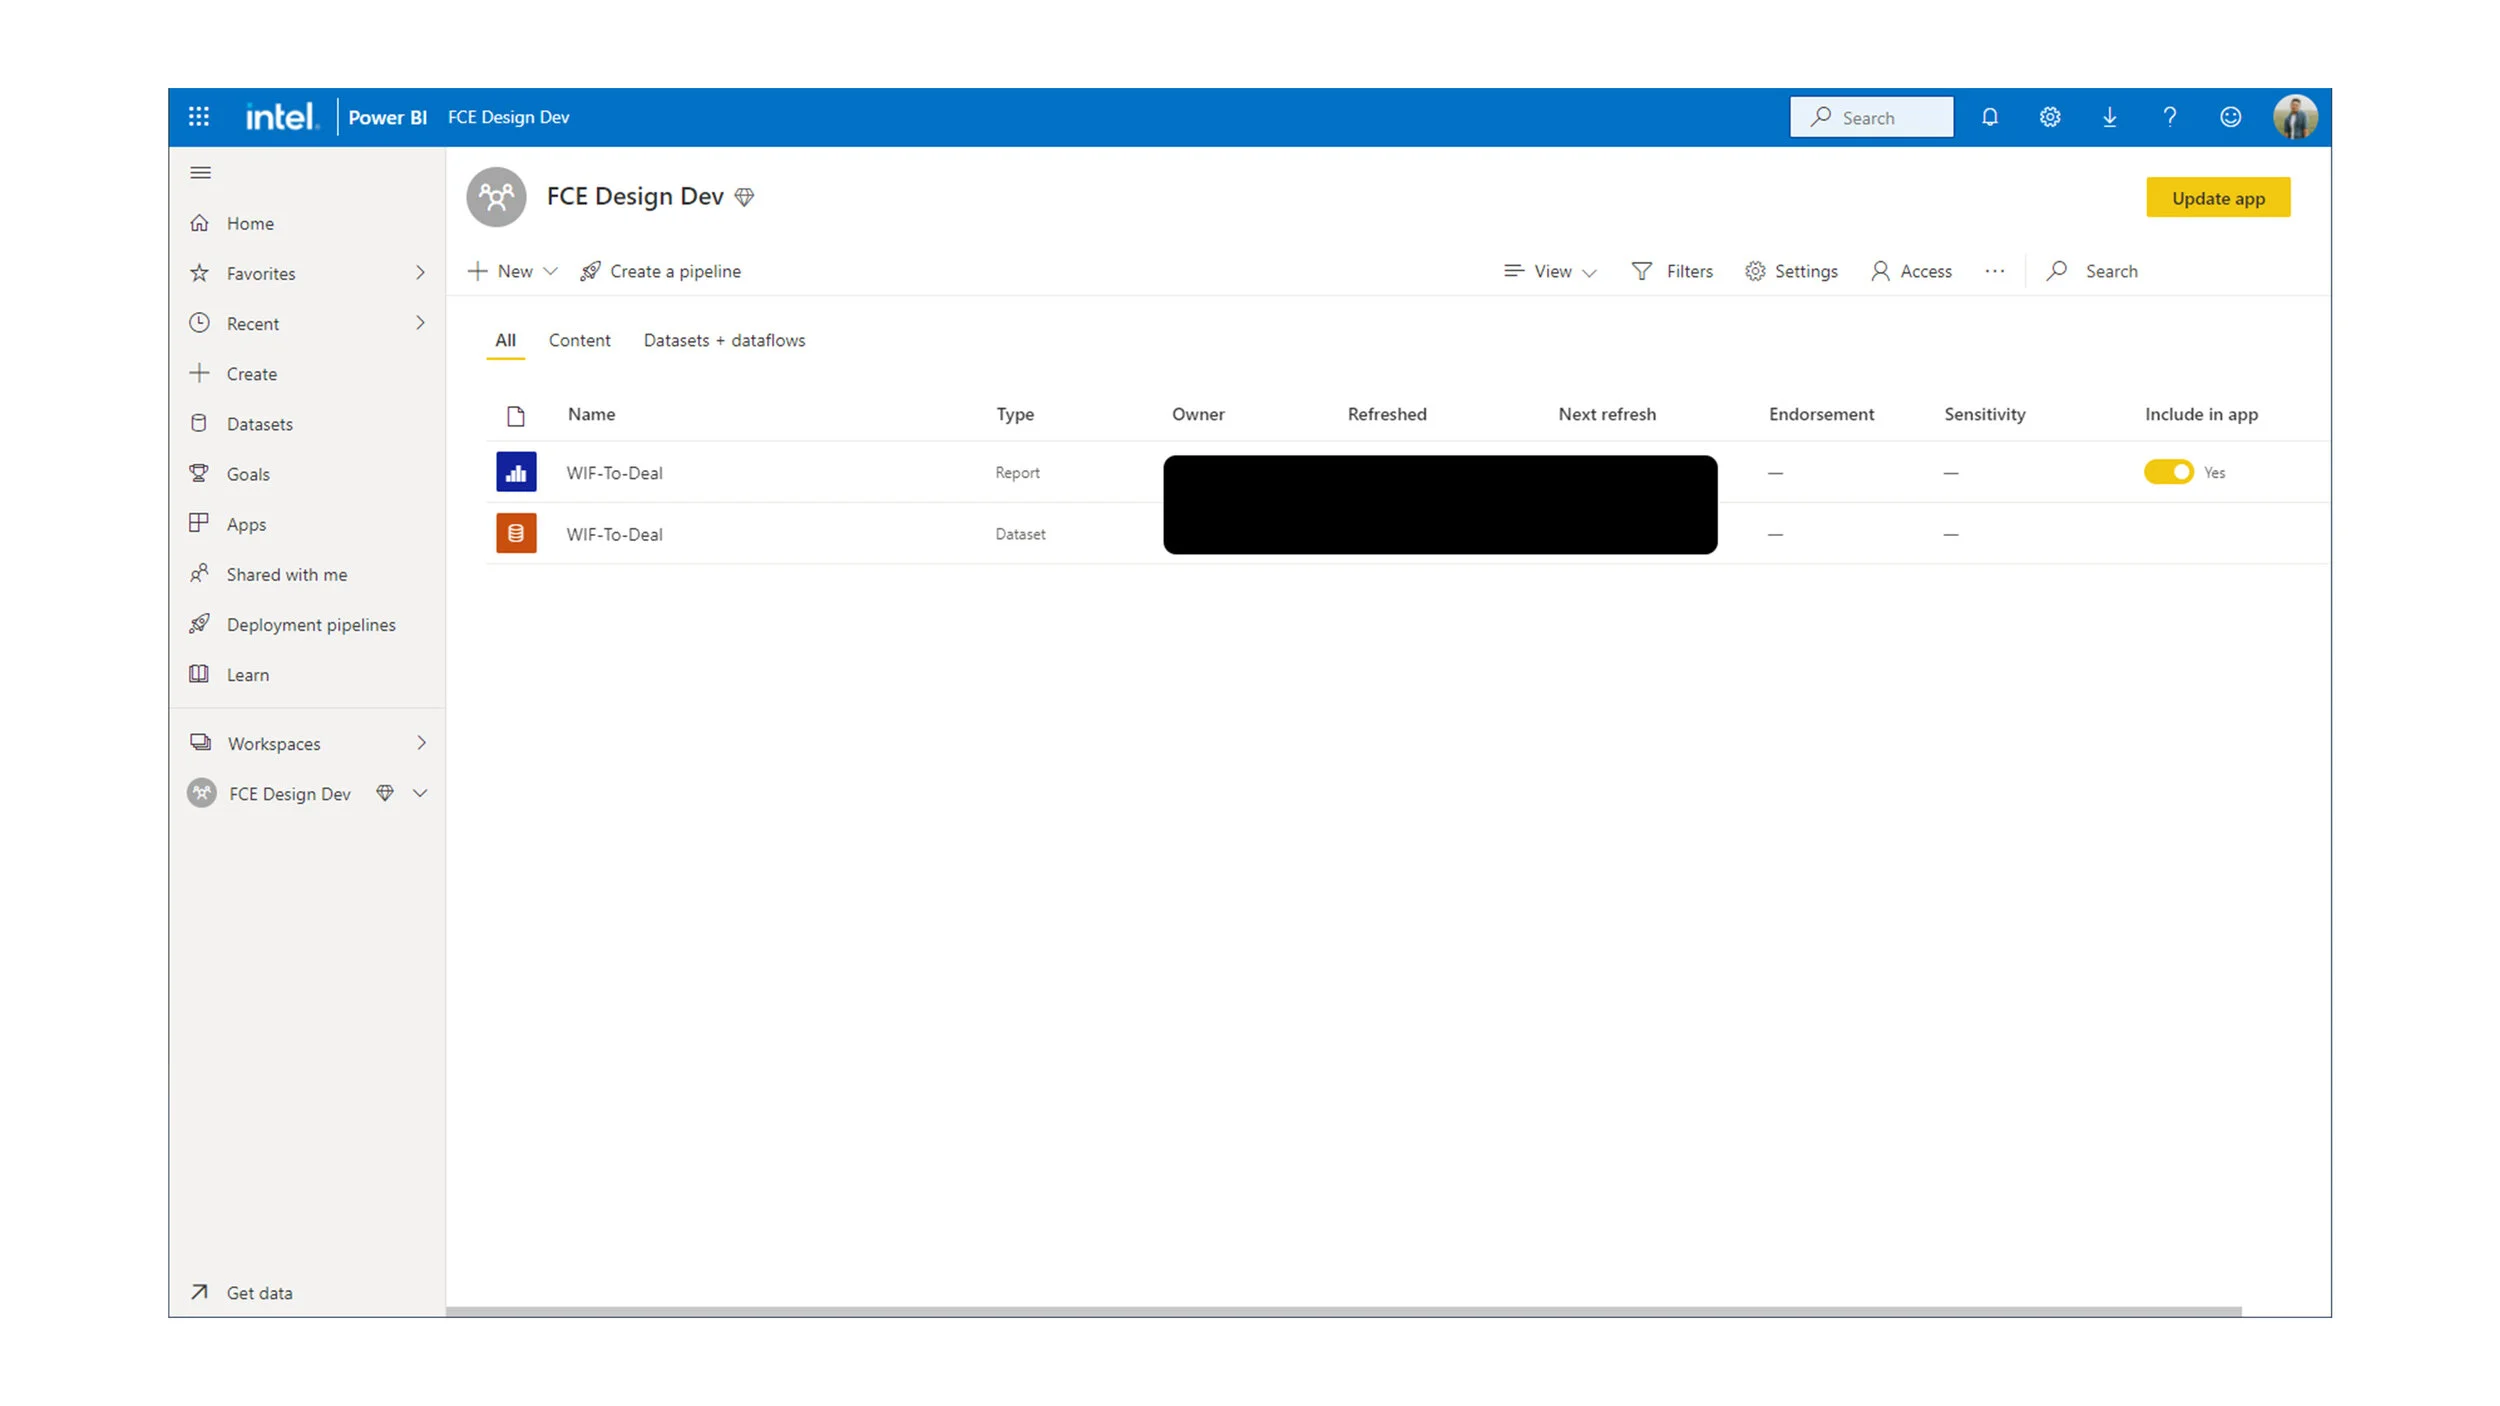
Now, through one PowerBI Cloud Dataset (next image), anyone is able to utilize the tables being brought in from Quickbase at any time. No need to connect or bring in tables manually, but instead it can be easily accessed for anyone to immediately create dashboards.
4.0 | CREATING KPI DASHBOARDS
4.1. | EXAMPLE FINAL INTERACTIVE DIAGRAMS
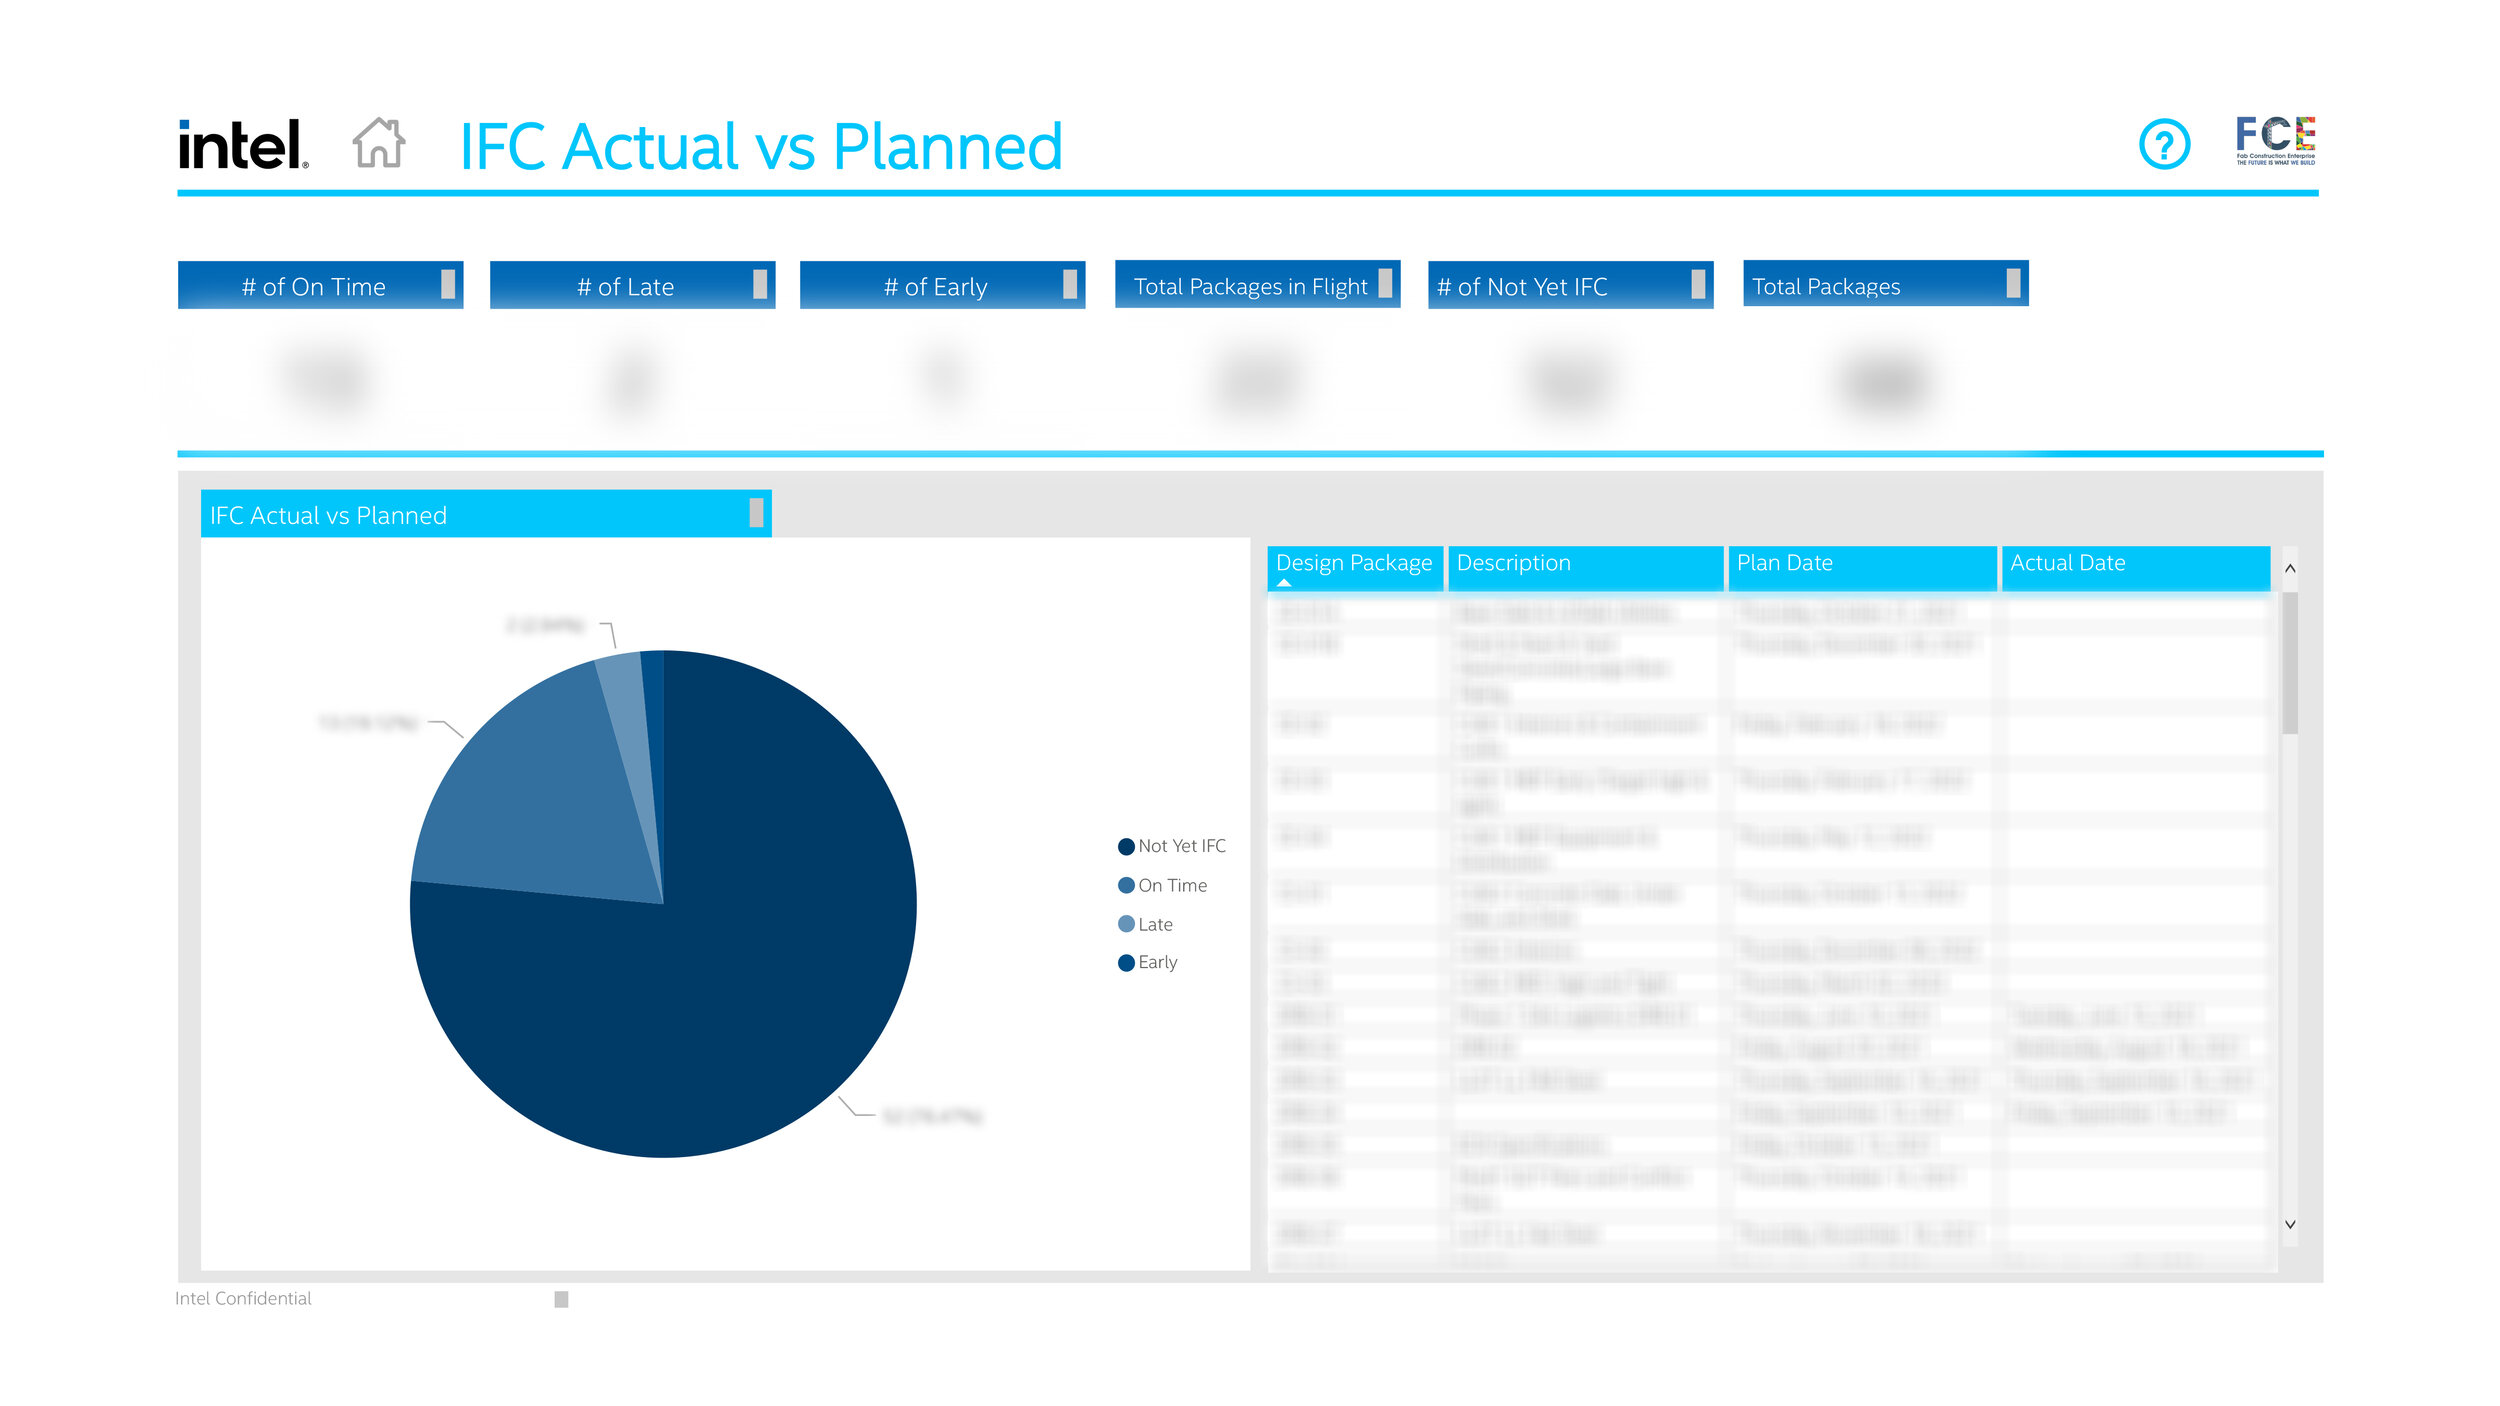
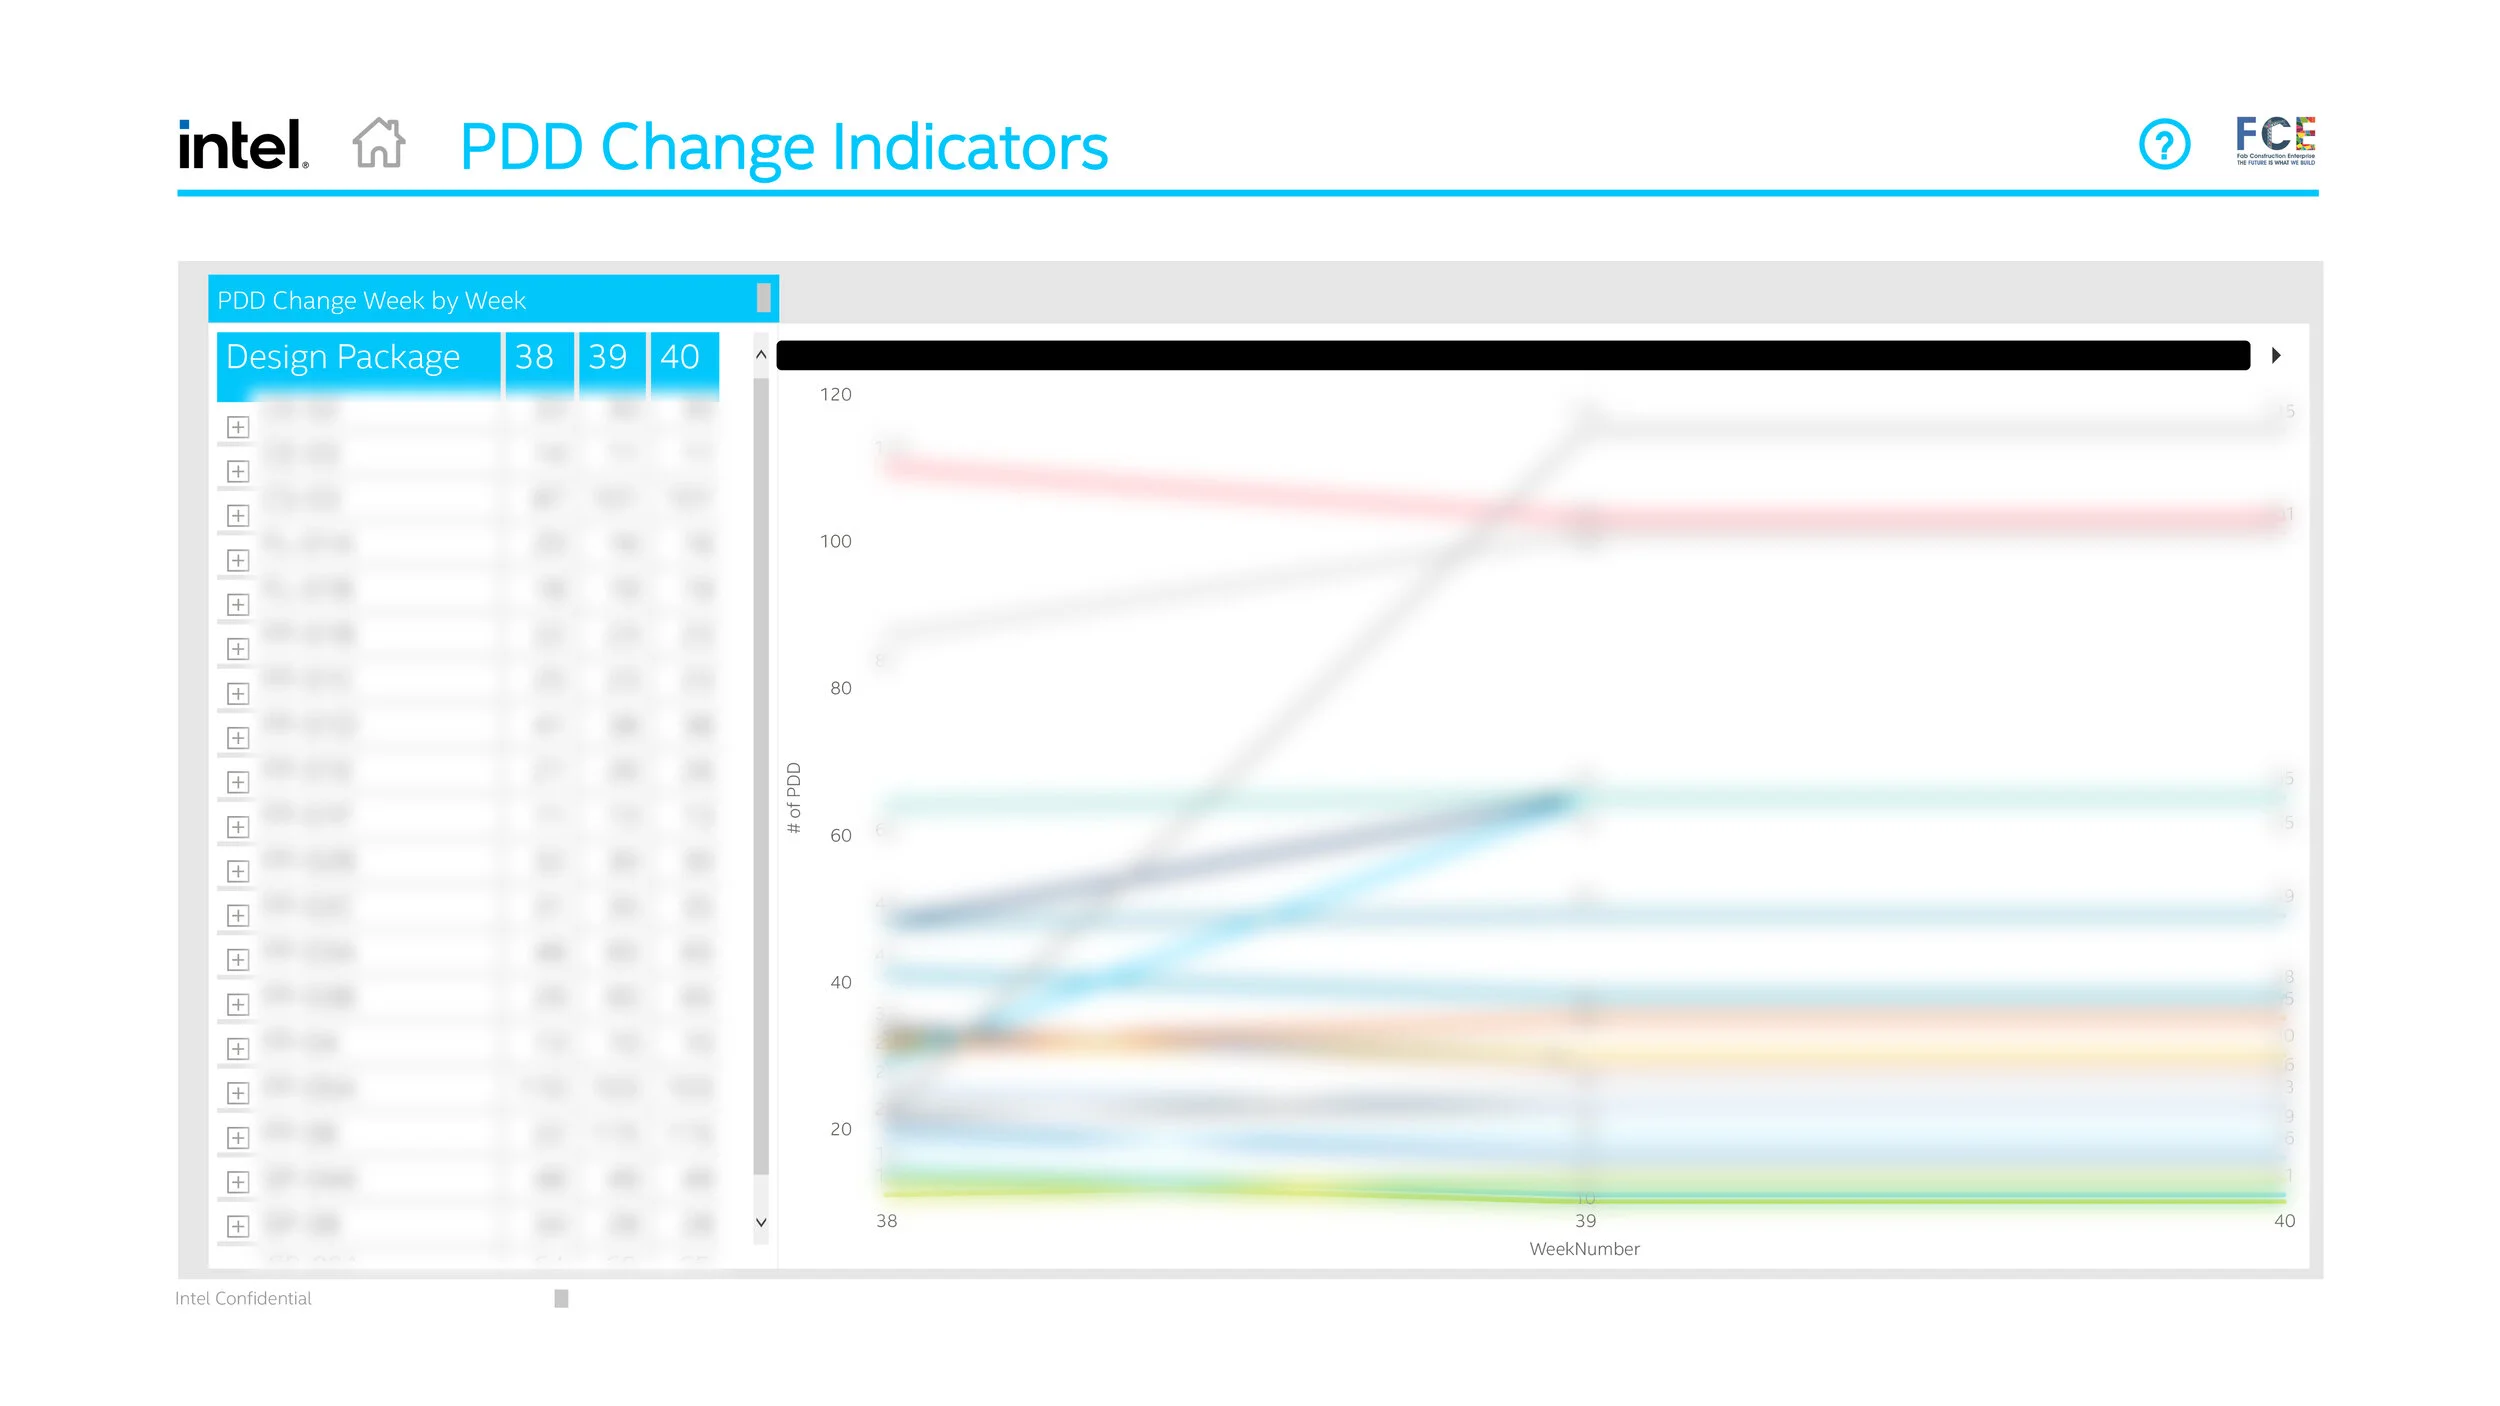
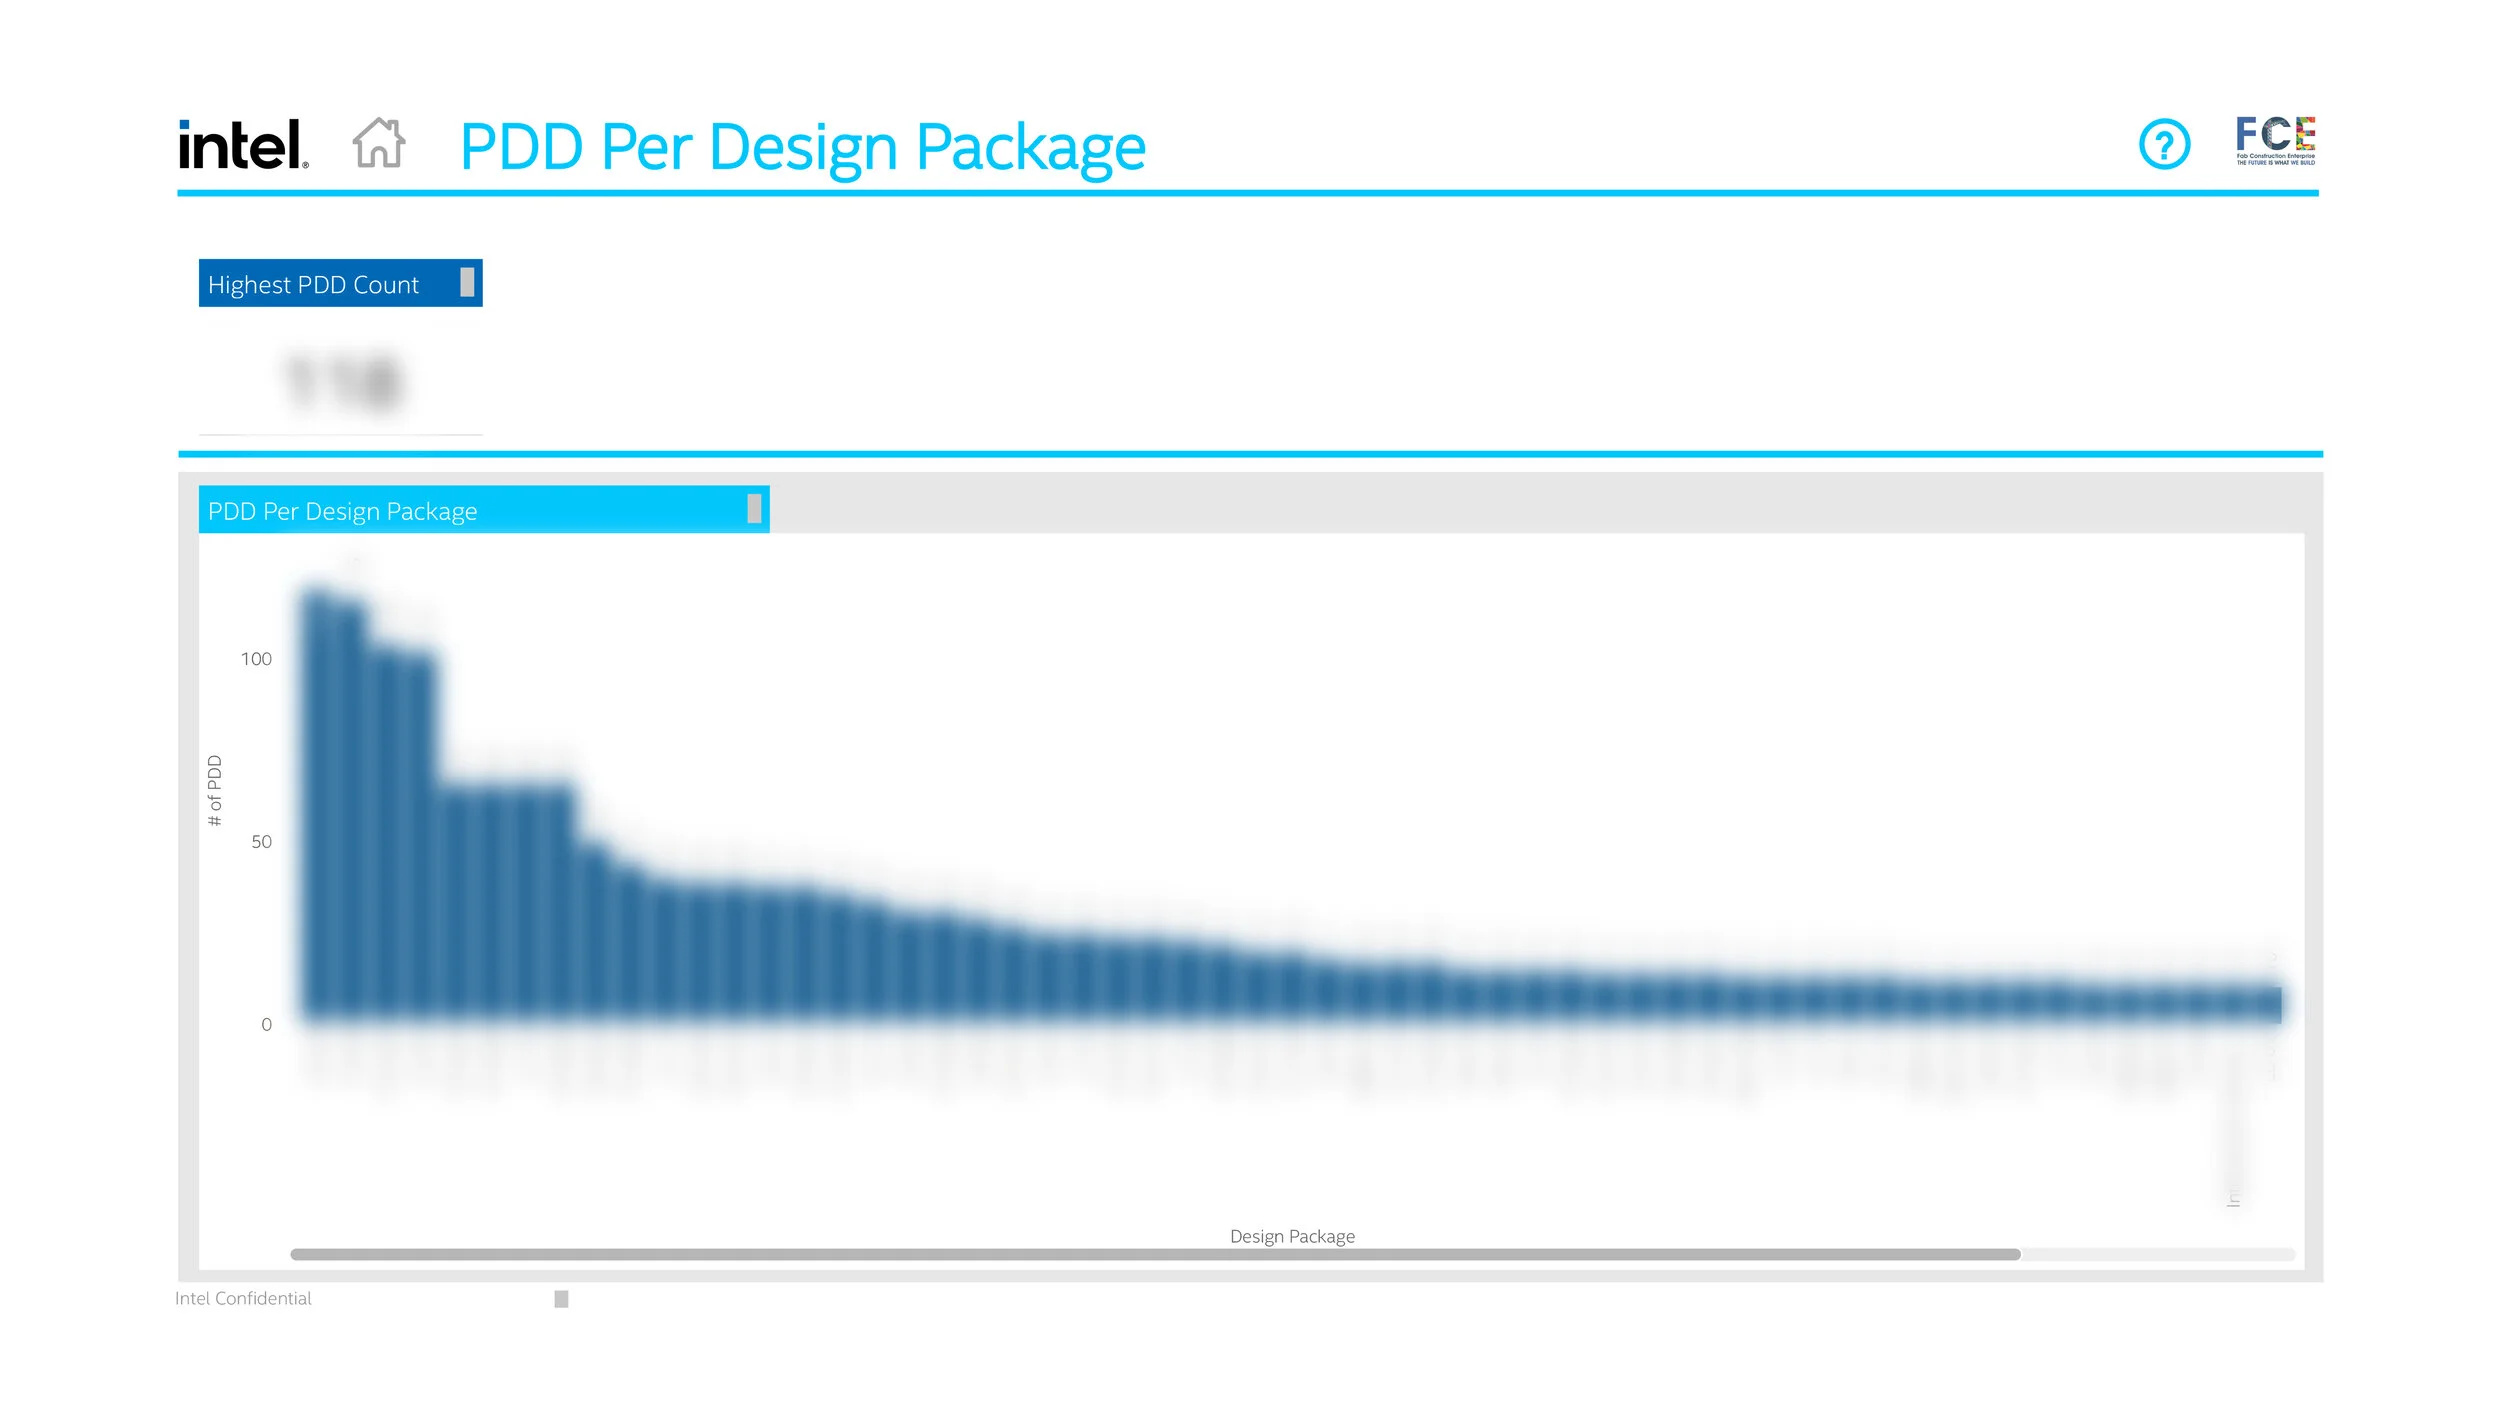
Due to all of the data being Intel Confidential information, I am unable to post and present these visualizations fully online.
To create these visuals, I implemented many DAX measures, Computed Columns, and Computed Tables that helped bring complex visualizations from change week over week to connecting Estimating Data to actual Fab Buyout Data. It was a challenging, yet incredible learning experience.
With what I have posted, I hope that you are still able to see the hard work, dedication, and passion that both myself and the team have put into these final interactive diagrams.
5.0 | FINAL THOUGHTS & THANK YOUS
wow… this summer flew by faster than I could say One Intel!
a special thanks to all of my team members that have been so patient with me and taught me through my own learning curves, but also celebrated with me on my victories!
Ashean, Mahmoud, Eduardo, Eric, & Herb…
I couldn’t have done it without you guys!